Technical Analysis of FDTB 2024-05-10
Overview:
In analyzing the technical indicators for FDTB stock over the last 5 days, we will delve into the trend, momentum, volatility, and volume indicators to provide a comprehensive outlook on the possible stock price movement in the coming days. By examining these key indicators, we aim to offer valuable insights and predictions for potential investors.
Trend Analysis:
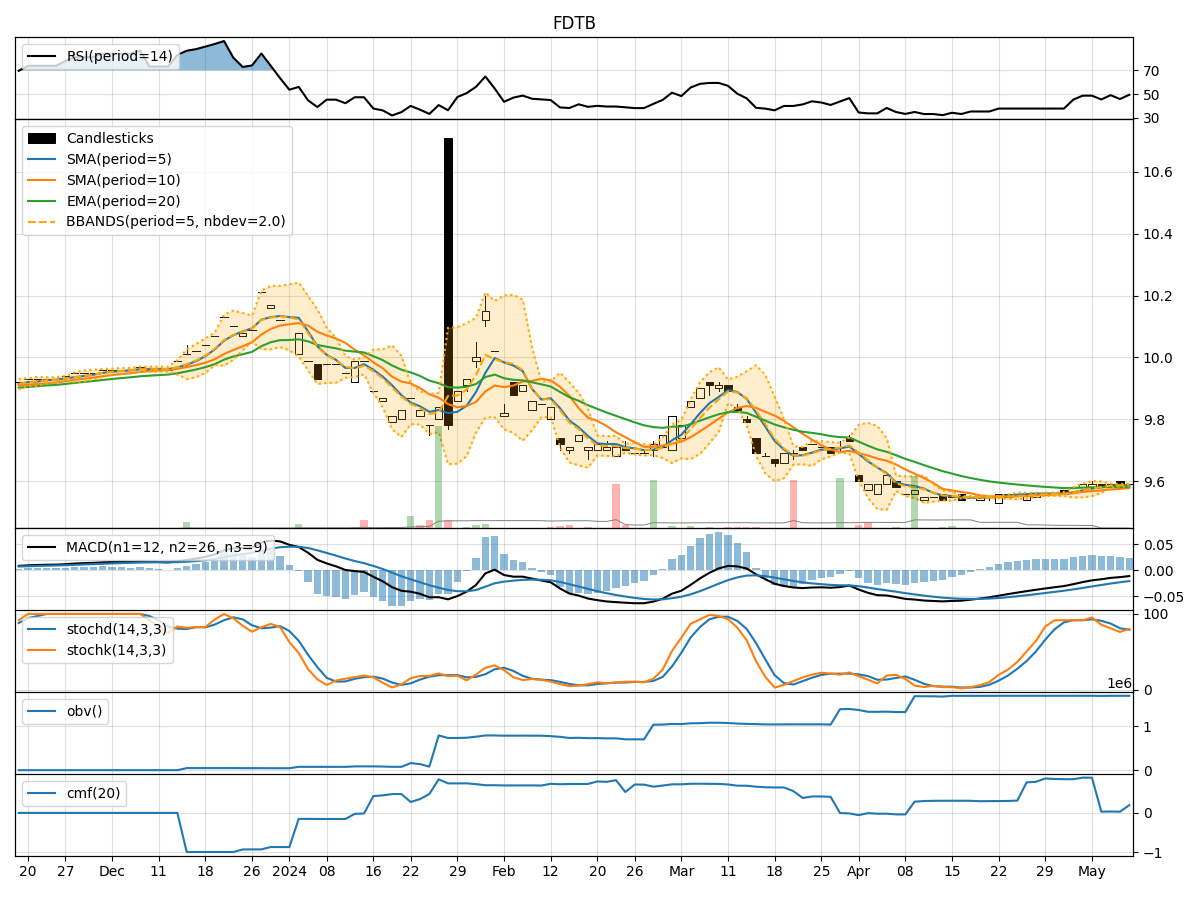
- Moving Averages (MA): The 5-day MA has been relatively stable around the current stock price, indicating a neutral trend.
- MACD: The MACD line has been consistently negative, suggesting a bearish trend in the short term.
- EMA: The EMA has shown a slight upward trend, but the overall momentum remains weak.
Momentum Analysis:
- RSI: The RSI values have been fluctuating around the mid-level, indicating a lack of strong momentum in either direction.
- Stochastic Oscillator: Both %K and %D values have been declining, signaling a potential bearish momentum.
- Williams %R: The Williams %R values have been hovering in the oversold territory, suggesting a possible reversal in the short term.
Volatility Analysis:
- Bollinger Bands (BB): The Bollinger Bands have narrowed, indicating decreasing volatility and a potential period of consolidation.
- BB %B: The %B values have been fluctuating around the mid-level, reflecting a lack of clear direction in terms of volatility.
Volume Analysis:
- On-Balance Volume (OBV): The OBV values have been relatively stable, suggesting a balanced accumulation and distribution of the stock.
- Chaikin Money Flow (CMF): The CMF values have been fluctuating around the neutral level, indicating a lack of strong buying or selling pressure.
Conclusion:
Based on the analysis of the technical indicators, the stock of FDTB is likely to experience sideways movement in the coming days. The trend indicators show a lack of clear direction, with a neutral to slightly bearish bias. The momentum indicators suggest a potential bearish momentum, while the volatility indicators point towards a period of consolidation. The volume indicators indicate a balanced accumulation and distribution of the stock.
Overall, the stock is expected to trade within a narrow range with a slight downward bias. Investors should exercise caution and closely monitor the key support and resistance levels for potential trading opportunities.