Technical Analysis of FDTS 2024-05-10
Overview:
In analyzing the technical indicators for FDTS over the last 5 days, we will delve into the trend, momentum, volatility, and volume indicators to provide a comprehensive outlook on the possible stock price movement in the coming days.
Trend Analysis:
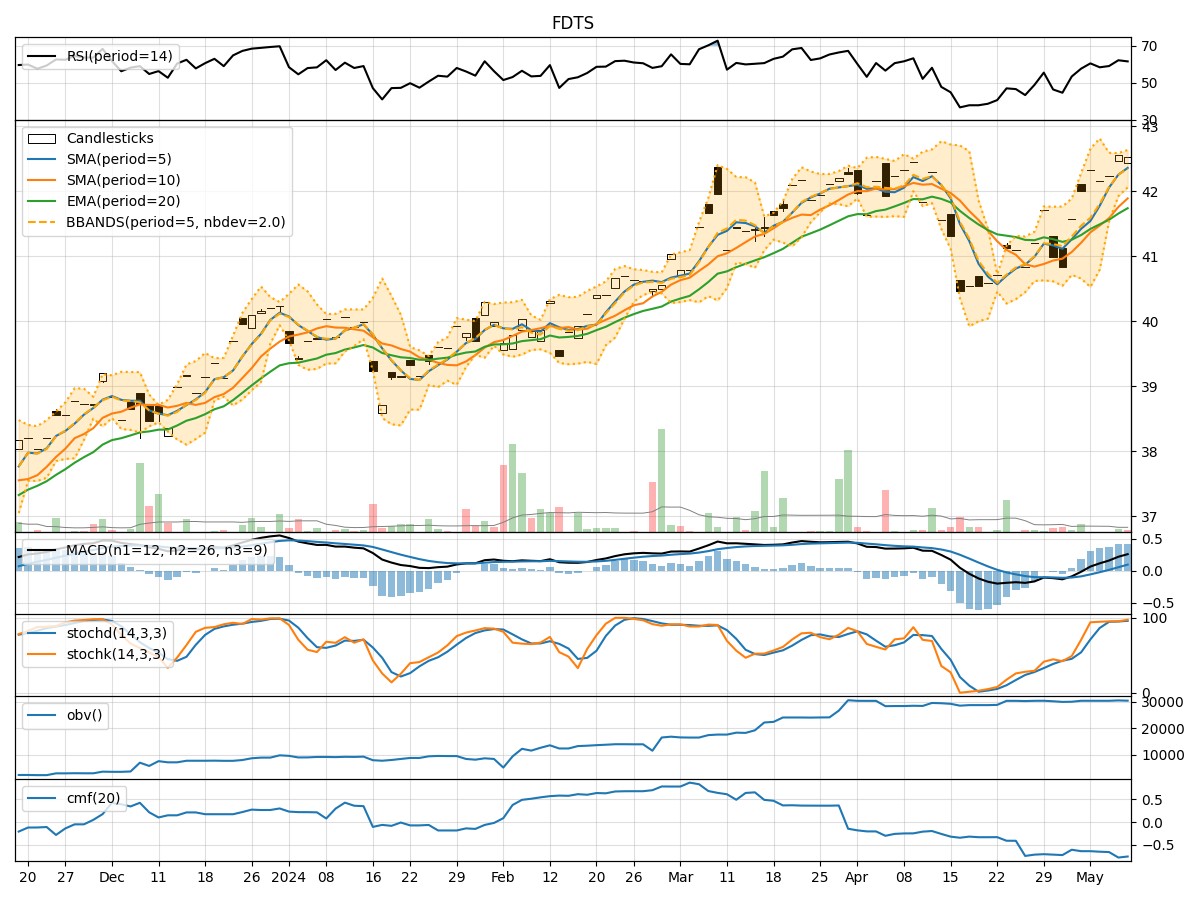
- Moving Averages (MA): The 5-day Moving Average (MA) has been consistently above the Simple Moving Average (SMA) and Exponential Moving Average (EMA), indicating a bullish trend.
- MACD: The MACD line has been consistently above the signal line, with the MACD Histogram showing positive values, suggesting a bullish momentum.
Momentum Analysis:
- RSI: The Relative Strength Index (RSI) has been fluctuating around the 60-62 range, indicating a neutral momentum.
- Stochastic Oscillator: Both %K and %D have been in the overbought zone, suggesting a potential reversal or consolidation.
- Williams %R: The Williams %R is hovering around -2% to -9%, indicating a slightly oversold condition.
Volatility Analysis:
- Bollinger Bands (BB): The stock price has been trading within the Bollinger Bands, with the %B indicator showing values around 0.66 to 0.91, indicating moderate volatility.
Volume Analysis:
- On-Balance Volume (OBV): The OBV has been relatively stable, indicating a balance between buying and selling pressure.
- Chaikin Money Flow (CMF): The CMF has been negative, suggesting a bearish money flow trend.
Key Observations:
- The trend indicators suggest a bullish sentiment with moving averages and MACD supporting an upward trend.
- Momentum indicators show a neutral to slightly overbought condition, indicating a potential consolidation or reversal.
- Volatility remains moderate, with the stock price trading within the Bollinger Bands.
- Volume indicators reflect a balanced OBV but a bearish money flow trend based on CMF.
Conclusion:
Based on the analysis of the technical indicators, the stock price of FDTS is likely to experience sideways movement or consolidation in the next few days. The bullish trend indicated by moving averages and MACD may face resistance due to the overbought conditions highlighted by the stochastic oscillator and Williams %R. The moderate volatility and balanced volume further support the view of a sideways trend. Traders should exercise caution and wait for clearer signals before making significant trading decisions.
Recommendation:
- Short-term Traders: Consider taking profits or reducing positions in anticipation of a potential consolidation phase.
- Long-term Investors: Monitor the price action closely for a clearer trend direction before making any significant investment decisions.
By carefully considering the interplay of these technical indicators, traders and investors can make more informed decisions in navigating the market dynamics of FDTS.