Technical Analysis of FDVL 2024-05-10
Overview:
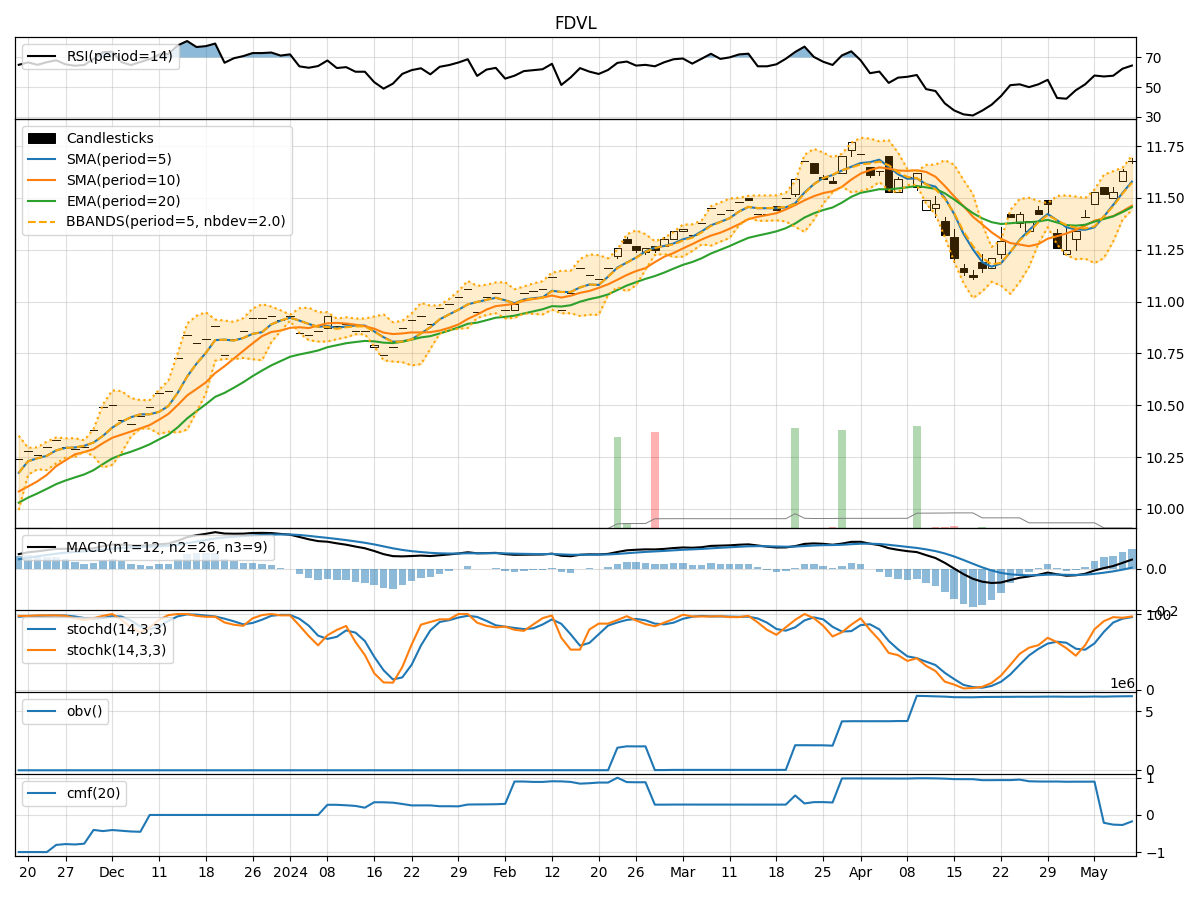
In analyzing the provided Technical Analysis (TA) data for the stock over the last 5 days, we will delve into the trend, momentum, volatility, and volume indicators to derive insights into the possible future stock price movement. By examining these key indicators, we aim to provide a comprehensive analysis and make informed predictions for the upcoming trading days.
Trend Analysis:
- Moving Averages (MA): The stock's closing prices have been consistently above the 5-day Moving Average (MA), indicating a short-term uptrend.
- MACD: The Moving Average Convergence Divergence (MACD) has been positive and increasing, suggesting bullish momentum.
- EMA: The Exponential Moving Average (EMA) has been trending upwards, supporting the bullish sentiment.
Momentum Analysis:
- RSI: The Relative Strength Index (RSI) has been in the overbought territory, indicating strong buying momentum.
- Stochastic Oscillator: Both %K and %D have been in the overbought zone, signaling potential for a pullback.
- Williams %R: The Williams %R is also in the oversold region, suggesting a possible reversal.
Volatility Analysis:
- Bollinger Bands: The stock price has been trading within the upper Bollinger Band (BBU), indicating increased volatility and potential for a breakout.
- Bollinger Band Width: The Band Width has been narrowing, suggesting a potential decrease in volatility.
Volume Analysis:
- On-Balance Volume (OBV): The OBV has been relatively flat, indicating a balance between buying and selling pressure.
- Chaikin Money Flow (CMF): The CMF has been negative, suggesting distribution in the stock.
Key Observations and Opinions:
- Trend: The stock is in a clear uptrend based on moving averages and MACD.
- Momentum: The momentum indicators suggest a potential pullback due to overbought conditions.
- Volatility: The narrowing Bollinger Bands indicate a potential decrease in volatility.
- Volume: The flat OBV and negative CMF suggest a lack of strong buying interest.
Conclusion:
Based on the analysis of the technical indicators, the stock is likely to experience a short-term pullback or consolidation in the upcoming trading days. Traders should exercise caution as the stock may enter a period of sideways movement before potentially resuming its uptrend. It is advisable to monitor key support and resistance levels closely to gauge the stock's future direction.