Technical Analysis of FDWM 2024-05-10
Overview:
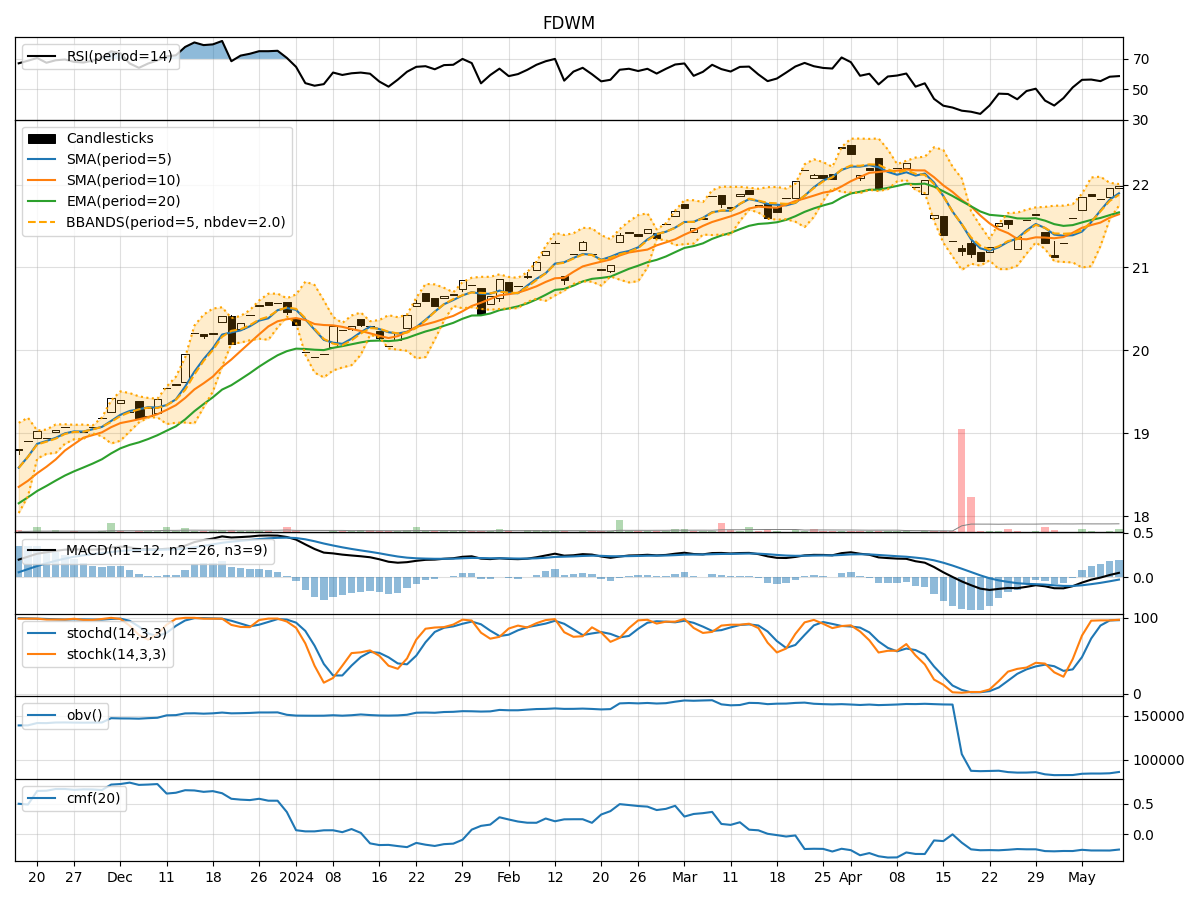
In analyzing the technical indicators for FDWM stock over the last 5 days, we will delve into the trend, momentum, volatility, and volume indicators to provide a comprehensive outlook on the possible stock price movement in the coming days. By examining these key indicators, we aim to offer valuable insights and predictions for potential investors.
Trend Indicators:
- Moving Averages (MA): The 5-day MA has been consistently above the closing prices, indicating a short-term uptrend.
- MACD: The MACD line has been positive and increasing, suggesting bullish momentum.
- EMA: The EMA has been trending upwards, supporting the bullish sentiment.
- Conclusion: The trend indicators point towards an upward movement in the stock price.
Momentum Indicators:
- RSI: The RSI has been in the neutral to slightly overbought territory, indicating moderate buying pressure.
- Stochastic Oscillator: Both %K and %D have been in the overbought zone, signaling potential for a pullback.
- Williams %R: The indicator has been hovering around the oversold region, suggesting a possible reversal.
- Conclusion: The momentum indicators suggest a mixed outlook with a potential for a short-term correction.
Volatility Indicators:
- Bollinger Bands (BB): The stock price has been trading within the bands, indicating normal volatility.
- Conclusion: Volatility remains stable, with no significant deviations from the bands.
Volume Indicators:
- On-Balance Volume (OBV): The OBV has been declining, indicating selling pressure.
- Chaikin Money Flow (CMF): The CMF has been negative, reflecting a lack of buying interest.
- Conclusion: Volume indicators suggest a bearish sentiment in the market.
Overall Conclusion:
Based on the analysis of trend, momentum, volatility, and volume indicators, the next few days' possible stock price movement for FDWM is likely to be sideways to slightly bearish. While the trend indicators point towards an upward movement, the momentum indicators indicate a potential for a short-term correction. The stable volatility suggests no major price swings, but the bearish volume indicators raise concerns about sustained buying interest. Investors should exercise caution and consider waiting for more clarity in market dynamics before making significant trading decisions.