Technical Analysis of FEBT 2024-05-10
Overview:
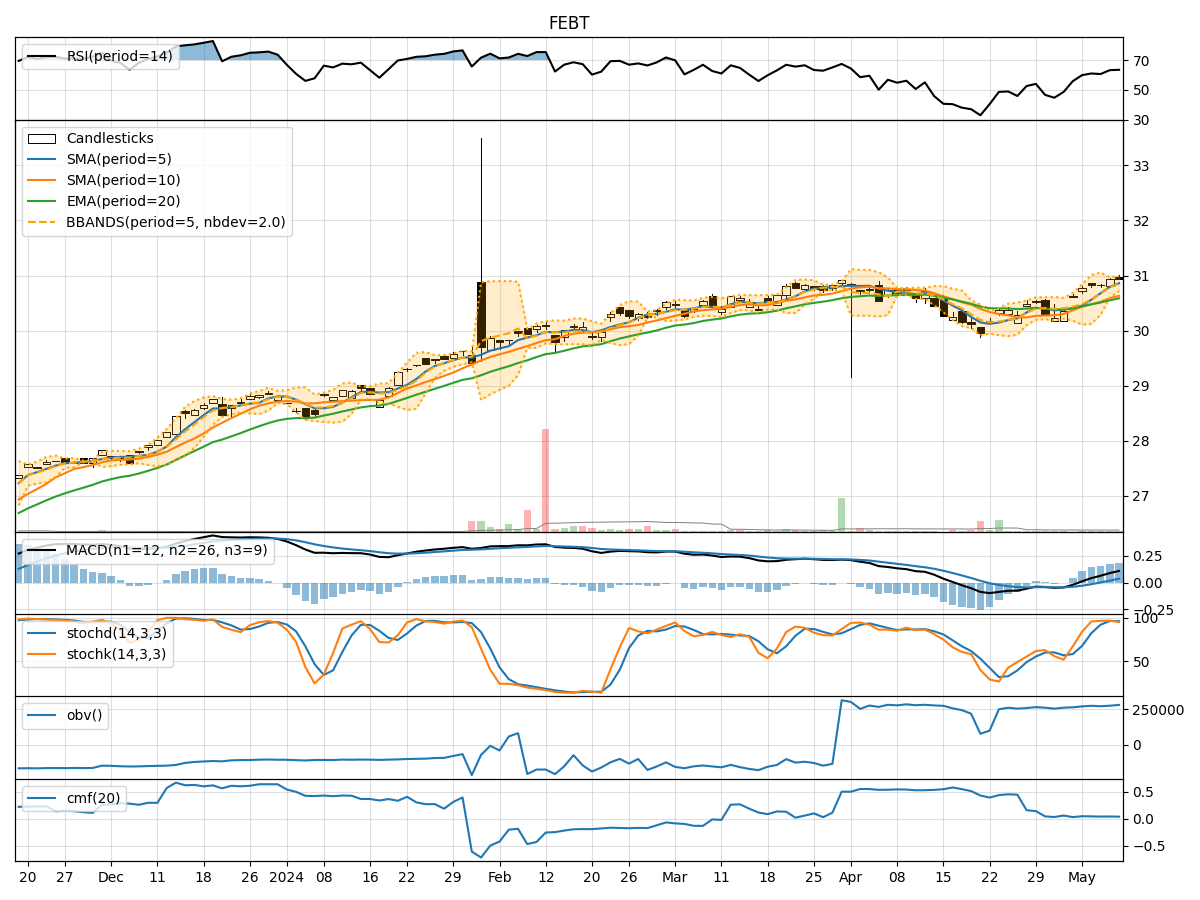
In analyzing the technical indicators for FEBT over the last 5 days, we will delve into the trend, momentum, volatility, and volume indicators to provide a comprehensive outlook on the possible stock price movement in the coming days. By examining key metrics such as moving averages, MACD, RSI, Bollinger Bands, and OBV, we aim to offer valuable insights and predictions for informed decision-making.
Trend Indicators:
- Moving Averages (MA): The 5-day MA has been consistently above the closing prices, indicating a bullish trend.
- MACD: The MACD line has been above the signal line, suggesting positive momentum.
- EMA: The EMA has been trending upwards, supporting the bullish sentiment.
Momentum Indicators:
- RSI: The RSI has been in the neutral to slightly overbought territory, indicating potential strength in the current uptrend.
- Stochastic Oscillator: Both %K and %D have been in the overbought zone, signaling a strong bullish momentum.
- Williams %R: The indicator has been in the oversold region, suggesting a potential reversal to the upside.
Volatility Indicators:
- Bollinger Bands: The stock price has been trading within the bands, indicating stable volatility.
- Bollinger %B: The %B has been fluctuating around 0.8, suggesting a balanced volatility level.
Volume Indicators:
- On-Balance Volume (OBV): The OBV has been steadily increasing, reflecting positive buying pressure.
- Chaikin Money Flow (CMF): The CMF has been positive, indicating money flow into the stock.
Key Observations and Opinions:
- Trend: The stock is in a strong uptrend supported by moving averages and MACD.
- Momentum: Momentum indicators suggest a bullish bias with overbought conditions.
- Volatility: Volatility remains stable within Bollinger Bands.
- Volume: Increasing OBV and positive CMF indicate buying interest in the stock.
Conclusion:
Based on the analysis of technical indicators, the next few days' possible stock price movement for FEBT is likely to be upward. The bullish trend, positive momentum, stable volatility, and increasing buying pressure suggest a favorable outlook for the stock. Traders and investors may consider buying opportunities in anticipation of further price appreciation.