Technical Analysis of FEBW 2024-05-10
Overview:
In analyzing the technical indicators for FEBW stock over the last 5 days, we will delve into the trend, momentum, volatility, and volume indicators to provide a comprehensive outlook on the possible stock price movement in the coming days. By examining these key aspects, we aim to offer valuable insights and predictions to guide investment decisions.
Trend Analysis:
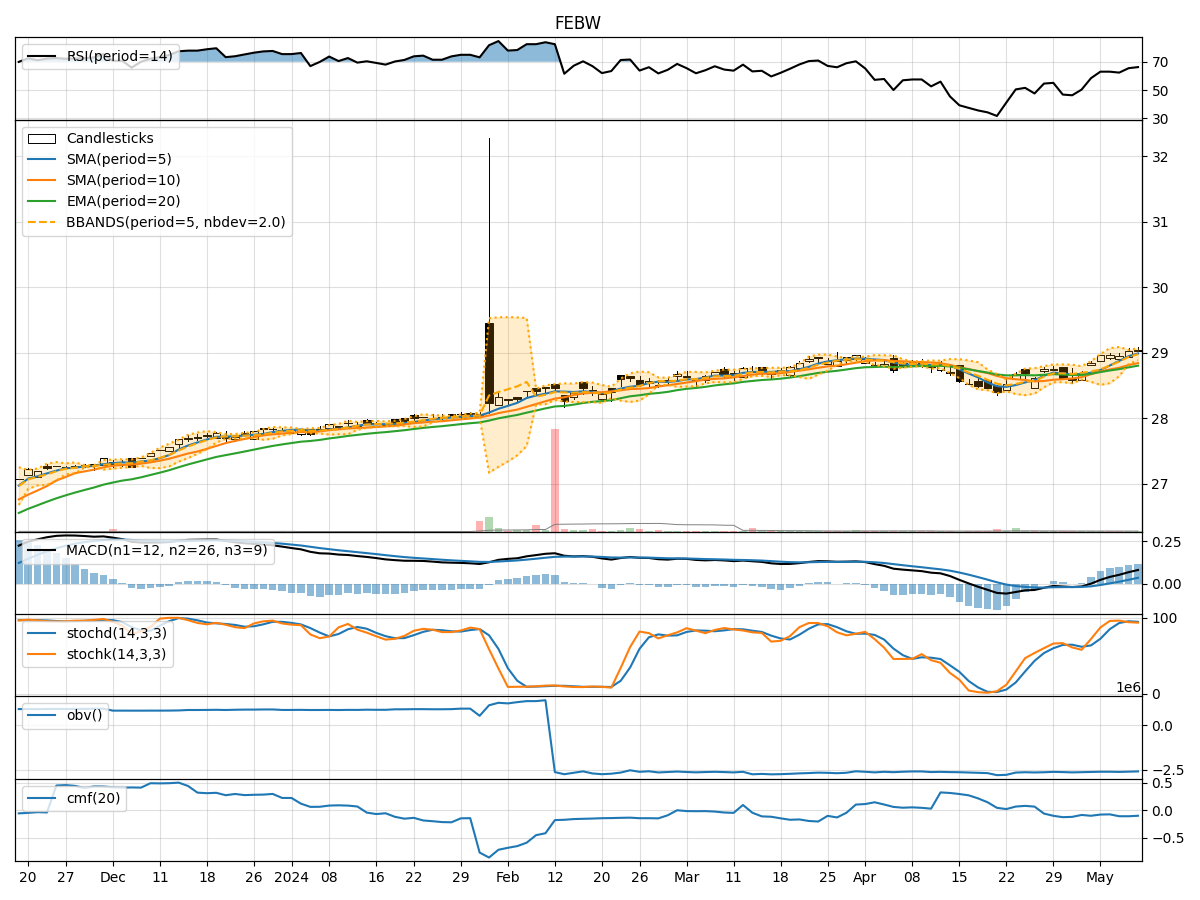
- Moving Averages (MA): The 5-day Moving Average (MA) has been consistently above the Simple Moving Average (SMA) and Exponential Moving Average (EMA), indicating a bullish trend.
- MACD: The MACD line has been consistently above the signal line, suggesting positive momentum in the stock price.
Key Observation: The trend indicators point towards a bullish sentiment in the stock price movement.
Momentum Analysis:
- RSI: The Relative Strength Index (RSI) has been hovering around 60-70, indicating a neutral to slightly bullish momentum.
- Stochastic Oscillator: Both %K and %D have been in the overbought zone, suggesting a potential reversal or consolidation.
Key Observation: The momentum indicators suggest a neutral to slightly bullish outlook for the stock.
Volatility Analysis:
- Bollinger Bands (BB): The stock price has been trading within the Bollinger Bands, with the bands narrowing, indicating decreasing volatility.
Key Observation: Volatility is decreasing, signaling a potential consolidation phase.
Volume Analysis:
- On-Balance Volume (OBV): The OBV has been fluctuating but has not shown a clear trend, indicating mixed buying and selling pressure.
- Chaikin Money Flow (CMF): The CMF has been negative, suggesting a lack of strong buying interest.
Key Observation: Volume indicators reflect mixed sentiment in the market.
Conclusion:
Based on the analysis of trend, momentum, volatility, and volume indicators, the next few days for FEBW stock are likely to see sideways movement with a slight bullish bias. Traders should exercise caution due to the potential for a consolidation phase as volatility decreases. It is advisable to closely monitor key support and resistance levels for potential breakout or reversal signals.
Key Recommendations:
- Monitor Price Levels: Keep a close eye on key support and resistance levels for potential breakout opportunities.
- Risk Management: Implement proper risk management strategies to protect against unexpected market movements.
- Stay Informed: Stay updated on market news and events that could impact the stock price.
In conclusion, while the technical indicators suggest a mixed outlook for FEBW stock, a cautious approach with a slight bullish bias is recommended for the next few days.