Technical Analysis of FELV 2024-05-10
Overview:
In analyzing the technical indicators for FELV over the last 5 days, we will delve into the trend, momentum, volatility, and volume indicators to provide a comprehensive outlook on the possible stock price movement in the coming days. By examining these key aspects, we aim to offer valuable insights and recommendations for potential investors.
Trend Analysis:
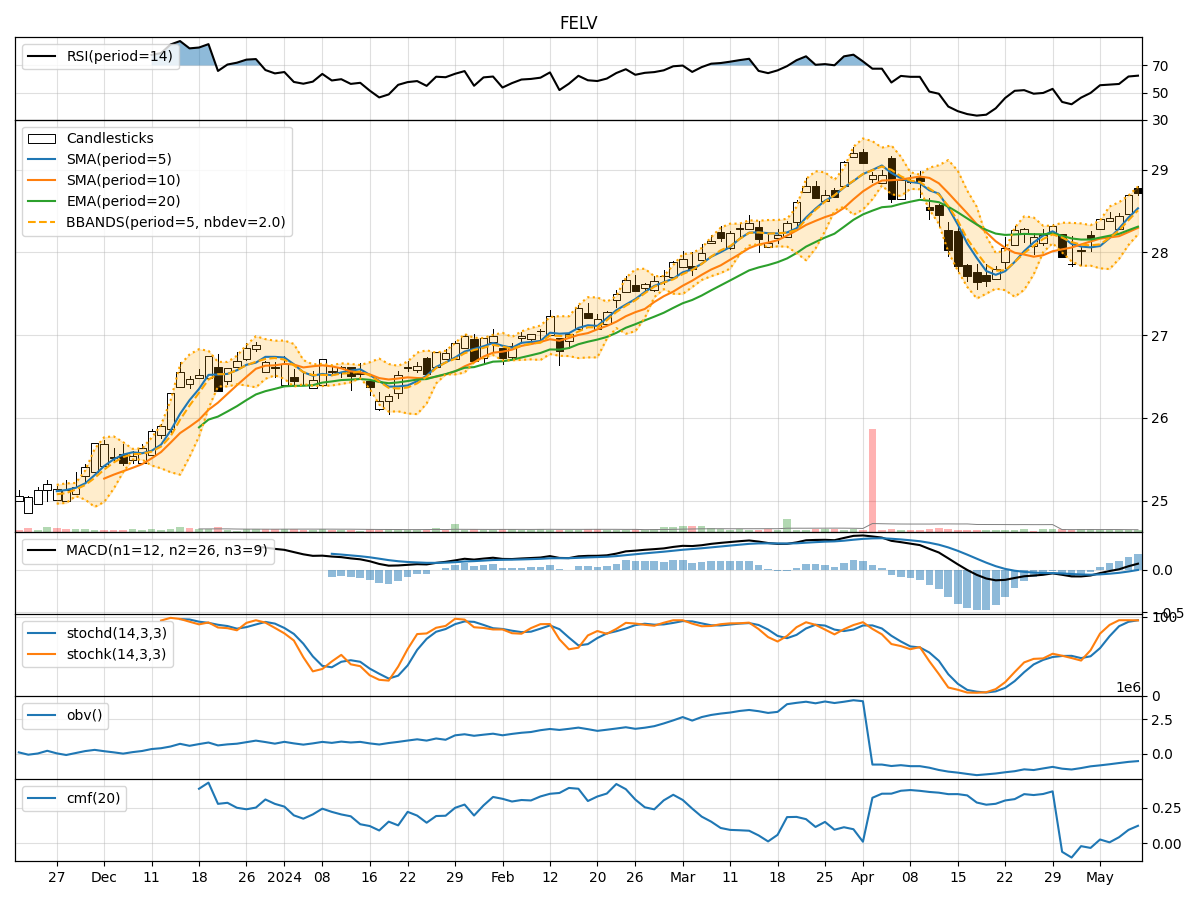
- Moving Averages (MA): The 5-day MA has been consistently above the closing prices, indicating a short-term uptrend.
- MACD: The MACD line has been above the signal line, with both showing positive values, suggesting bullish momentum.
- EMA: The EMA has been trending upwards, reflecting a positive price trend.
Key Observation: The trend indicators point towards a bullish sentiment in the short term.
Momentum Analysis:
- RSI: The RSI has been increasing and is currently in the overbought territory, signaling strong buying momentum.
- Stochastic Oscillator: Both %K and %D have been in the overbought zone, indicating a potential reversal.
- Williams %R: The indicator has been fluctuating around the oversold region, suggesting a mixed momentum.
Key Observation: Momentum indicators show a mixed signal, with some pointing towards a potential reversal due to overbought conditions.
Volatility Analysis:
- Bollinger Bands (BB): The stock price has been trading within the bands, with the bands narrowing, indicating decreasing volatility.
- Bollinger %B: The %B indicator has been hovering around 0.8, suggesting the stock is trading near the upper band.
Key Observation: Volatility indicators suggest a consolidation phase with decreasing volatility.
Volume Analysis:
- On-Balance Volume (OBV): The OBV has been showing a slight decrease, indicating some distribution happening.
- Chaikin Money Flow (CMF): The CMF has been positive, reflecting buying pressure in the stock.
Key Observation: Volume indicators hint at mixed sentiment, with OBV showing distribution while CMF indicates buying pressure.
Conclusion:
Based on the analysis of the technical indicators, the next few days for FELV stock price movement could see a continuation of the bullish trend in the short term. However, the mixed signals from momentum indicators suggest a potential reversal or correction in the near future. The decreasing volatility indicates a consolidation phase, while volume indicators show a mixed sentiment with some distribution evident.
Recommendation:
Considering the overall analysis, investors should exercise caution and closely monitor the stock price for any signs of a reversal or correction. It is advisable to wait for more clarity in momentum indicators before making significant trading decisions. Additionally, keeping an eye on key support and resistance levels can help in determining potential entry and exit points.
Disclaimer:
This analysis is based solely on technical indicators and historical data, and it is essential to consider other fundamental factors and market dynamics before making any investment decisions. Consulting with a financial advisor for personalized guidance is recommended.