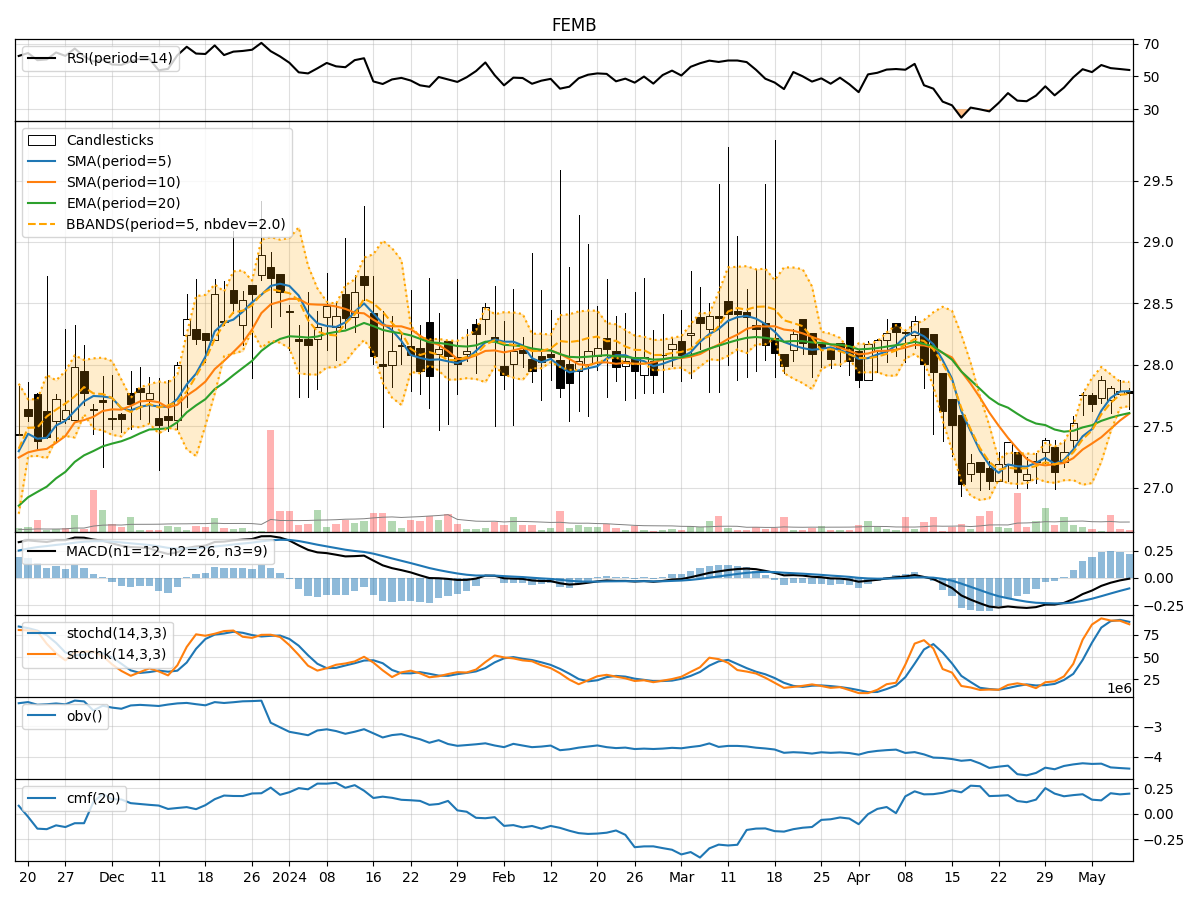
Technical Analysis of FEMB 2024-05-10
Overview:
In analyzing the technical indicators for FEMB over the last 5 days, we will delve into the trend, momentum, volatility, and volume indicators to provide a comprehensive outlook on the possible stock price movement in the coming days. By examining these key indicators, we aim to offer valuable insights and predictions to guide investment decisions.
Trend Analysis:
- Moving Averages (MA): The 5-day MA has been consistently above the 10-day SMA, indicating a short-term bullish trend. The EMA(20) has shown a slight upward trend, suggesting positive momentum.
- MACD: The MACD line has been below the signal line but trending towards convergence, indicating a potential bullish crossover in the near future.
- Conclusion: The trend indicators suggest a bullish sentiment in the short term.
Momentum Analysis:
- RSI: The RSI has been fluctuating around the neutral 50 level, indicating a lack of strong momentum in either direction.
- Stochastic Oscillator: Both %K and %D have been in the overbought territory, suggesting a potential reversal or consolidation.
- Conclusion: The momentum indicators signal a neutral stance with a potential for a reversal.
Volatility Analysis:
- Bollinger Bands (BB): The stock price has been trading within the bands, indicating a period of consolidation. The bands are narrowing, suggesting a potential breakout.
- Conclusion: Volatility indicators point towards a sideways movement with a potential for increased volatility.
Volume Analysis:
- On-Balance Volume (OBV): The OBV has been declining, indicating selling pressure in the stock.
- Chaikin Money Flow (CMF): The CMF has been positive, suggesting accumulation by investors despite the declining OBV.
- Conclusion: Volume indicators reflect a mixed sentiment with selling pressure but signs of accumulation.
Overall Conclusion:
Based on the analysis of trend, momentum, volatility, and volume indicators, the next few days for FEMB are likely to see a sideways movement with a potential for increased volatility. The trend indicators suggest a short-term bullish sentiment, while momentum indicators signal a neutral stance with a potential for a reversal. Volume indicators reflect a mixed sentiment with selling pressure but signs of accumulation. Traders should closely monitor the potential breakout indicated by the narrowing Bollinger Bands and be prepared for increased volatility in the stock price.
Key Recommendations:
- Monitor Breakout: Watch for a potential breakout from the narrowing Bollinger Bands for a directional bias.
- Risk Management: Implement proper risk management strategies to navigate the increased volatility.
- Confirmation: Wait for confirmation from multiple indicators before making significant trading decisions.
By considering these factors and staying informed about market developments, investors can make well-informed decisions regarding their positions in FEMB.