Technical Analysis of FENI 2024-05-10
Overview:
In analyzing the technical indicators for FENI stock over the last 5 days, we will delve into the trend, momentum, volatility, and volume indicators to provide a comprehensive outlook on the possible future stock price movement. By examining these key indicators, we aim to offer valuable insights and predictions for the upcoming trading days.
Trend Indicators:
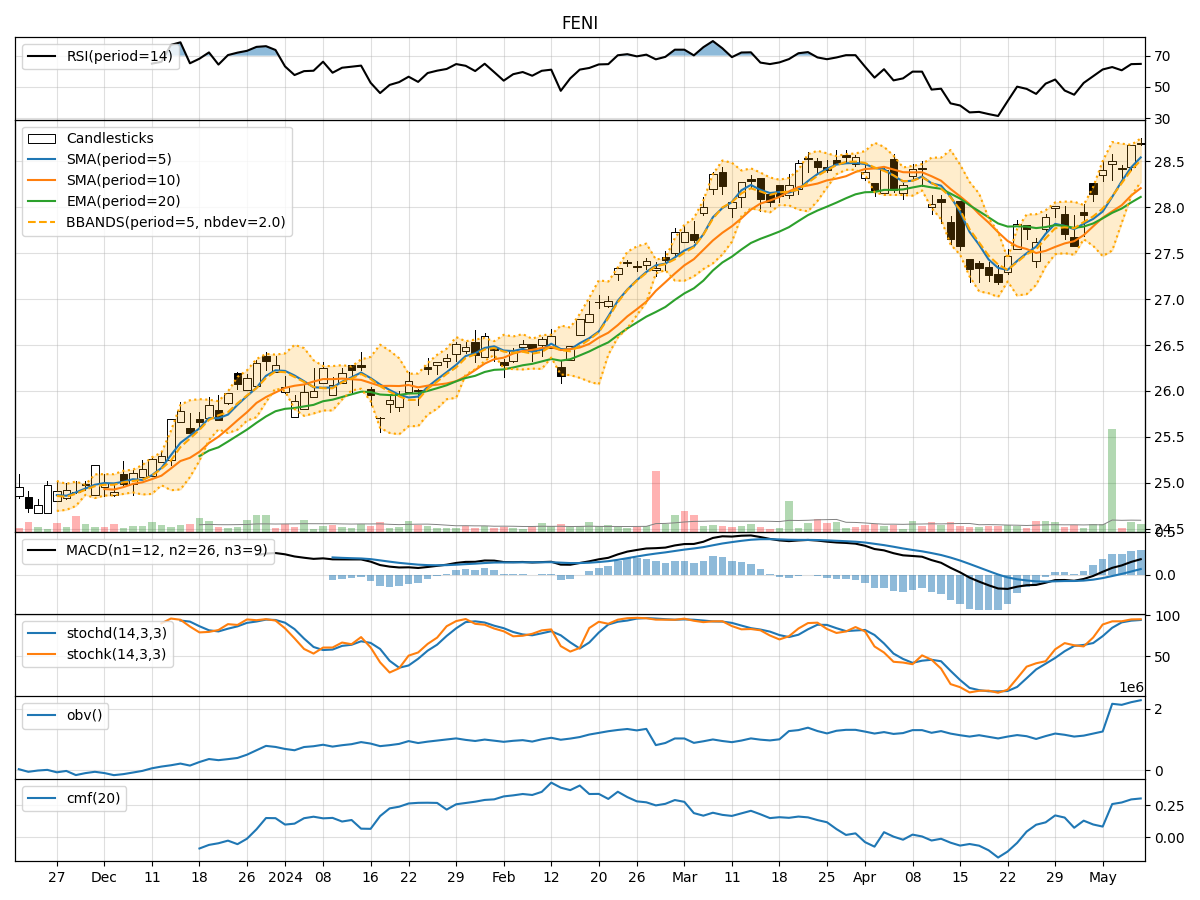
- Moving Averages (MA): The 5-day MA has been consistently above the 10-day SMA, indicating a short-term bullish trend. The EMA(20) has been steadily increasing, reflecting positive momentum in the stock price.
- MACD: The MACD line has been above the signal line for the past 5 days, suggesting bullish momentum. The MACD histogram has also been trending upwards, indicating strengthening bullish momentum.
Momentum Indicators:
- RSI: The RSI has been in the range of 60-65, indicating a neutral to slightly bullish sentiment. There is room for potential upside movement before reaching overbought levels.
- Stochastic Oscillator: Both %K and %D lines have been consistently high, suggesting strong buying pressure. However, %K approaching overbought territory may signal a potential reversal or consolidation.
Volatility Indicators:
- Bollinger Bands (BB): The stock price has been trading within the upper Bollinger Band, indicating an overbought condition. The narrowing of the bands suggests a potential decrease in volatility.
- Bollinger %B: The %B indicator has been hovering around 0.8, indicating that the stock is trading near the upper band. This could signal a potential pullback or consolidation.
Volume Indicators:
- On-Balance Volume (OBV): The OBV has been steadily increasing over the past 5 days, indicating strong buying volume supporting the uptrend in the stock price.
- Chaikin Money Flow (CMF): The CMF has been positive and trending upwards, indicating that money is flowing into the stock. This supports the bullish sentiment in the market.
Conclusion:
Based on the analysis of the technical indicators, the overall outlook for FENI stock in the next few days is bullish with a potential for further upside movement. The trend indicators, momentum indicators, and volume indicators all point towards a continuation of the current uptrend. However, caution should be exercised as the stock is trading near overbought levels based on the Bollinger Bands and Stochastic Oscillator. Traders should monitor for potential signs of a pullback or consolidation in the near term.
In summary, the next few days for FENI stock are likely to see upward movement with the potential for a continuation of the bullish trend. Investors should consider maintaining a watchful eye on key resistance levels and indicators for any signs of a reversal in the market sentiment.