Technical Analysis of FEP 2024-05-10
Overview:
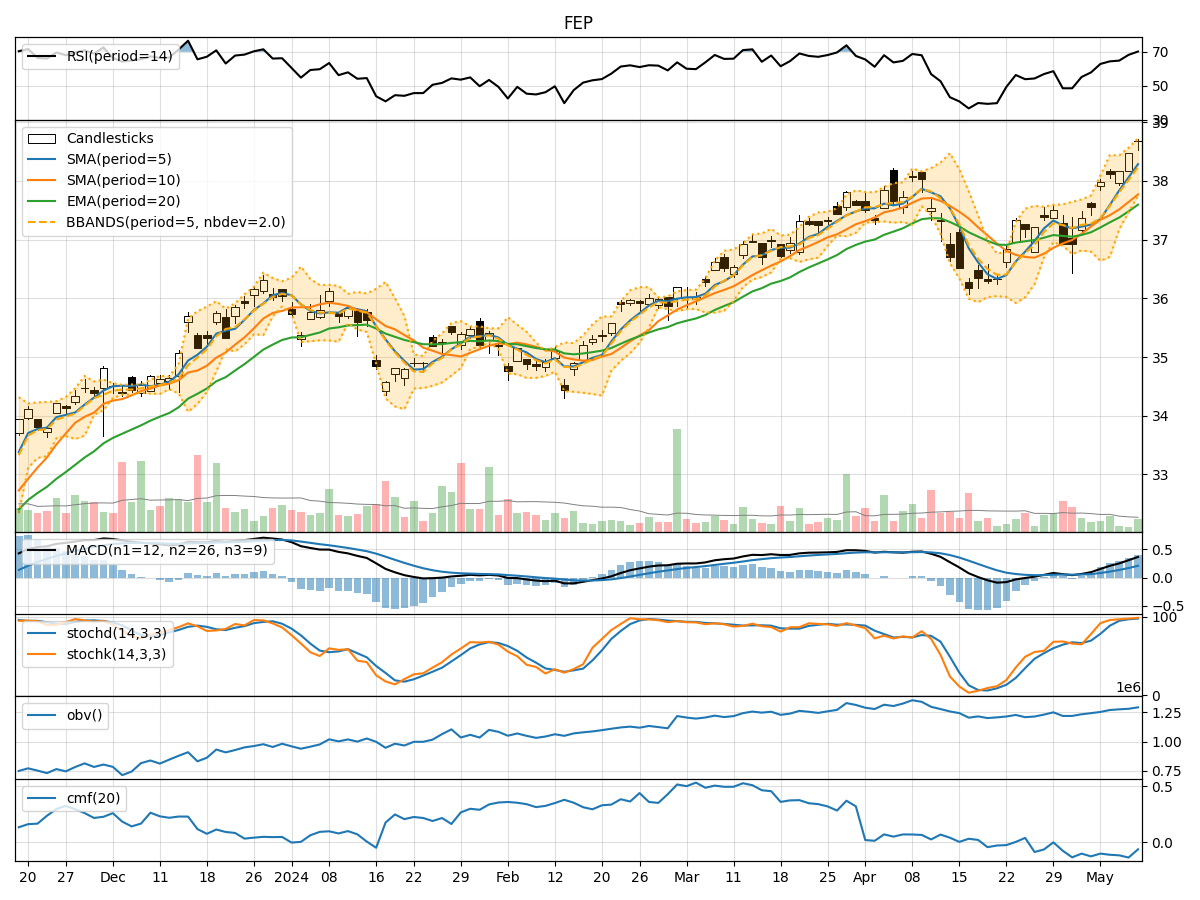
In analyzing the technical indicators for FEP stock over the last 5 days, we will delve into the trends, momentum, volatility, and volume indicators to provide a comprehensive outlook on the possible stock price movement in the coming days. By examining these key indicators, we aim to offer valuable insights and predictions for potential investors.
Trend Indicators:
- Moving Averages (MA): The 5-day Moving Average has been consistently rising, indicating a bullish trend in the short term.
- MACD: The MACD line has been increasing, showing positive momentum in the stock price.
- MACD Histogram: The histogram has also been on the rise, suggesting strengthening bullish momentum.
Momentum Indicators:
- RSI: The Relative Strength Index has been increasing, signaling that the stock is in overbought territory.
- Stochastic Oscillator: Both %K and %D have been trending upwards, indicating strong buying pressure.
- Williams %R: The indicator is in oversold territory, suggesting a potential reversal in the stock price.
Volatility Indicators:
- Bollinger Bands: The stock price has been trading within the bands, indicating moderate volatility.
- Bollinger %B: The %B value has been fluctuating around the midline, suggesting a balanced market sentiment.
Volume Indicators:
- On-Balance Volume (OBV): The OBV has been increasing, showing accumulation of the stock.
- Chaikin Money Flow (CMF): The CMF has been negative, indicating selling pressure in the stock.
Key Observations:
- The trend indicators suggest a bullish sentiment in the short term.
- Momentum indicators point towards overbought conditions, which may lead to a potential pullback.
- Volatility indicators show moderate price fluctuations, indicating a stable market environment.
- Volume indicators reflect mixed signals with OBV rising but CMF being negative.
Conclusion:
Based on the analysis of the technical indicators, the next few days' possible stock price movement for FEP is likely to be upward in the short term due to the bullish trend and positive momentum. However, caution is advised as the stock is currently in overbought territory according to the RSI and Williams %R indicators, which could lead to a correction or consolidation. Traders should closely monitor the price action and consider taking profits or implementing risk management strategies to navigate potential market fluctuations.