Technical Analysis of FEPI 2024-05-10
Overview:
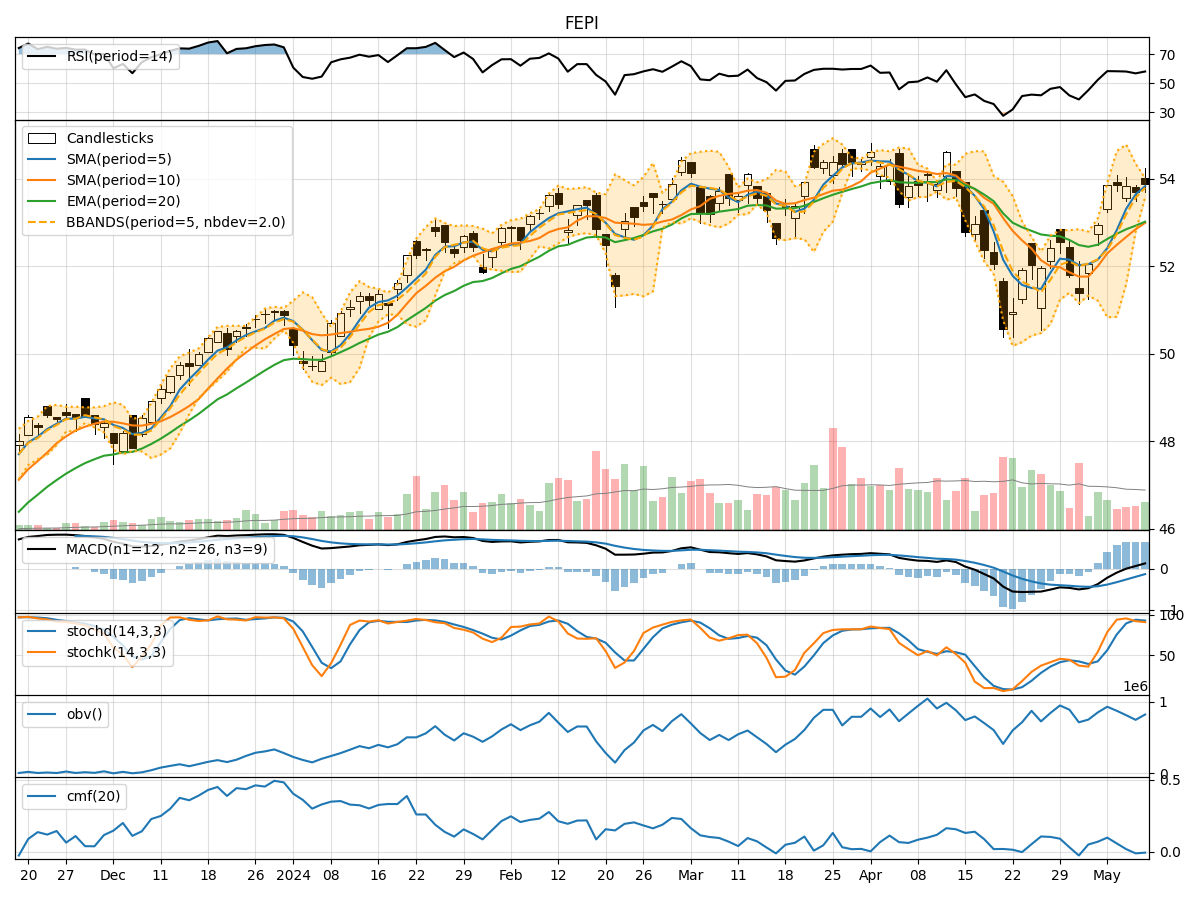
In analyzing the technical indicators for FEPI over the last 5 days, we will delve into the trends, momentum, volatility, and volume aspects to provide a comprehensive outlook on the possible stock price movement. By examining these key indicators, we aim to offer valuable insights and predictions for the upcoming days.
Trend Analysis:
- Moving Averages (MA): The moving averages show a consistent uptrend over the last 5 days, with the closing price consistently above the short-term moving averages.
- MACD: The MACD indicator has been positive, indicating a bullish momentum in the stock price.
- EMA: The exponential moving average has been steadily increasing, reflecting a positive trend in the stock price.
Key Observation: The trend indicators suggest a bullish outlook for FEPI based on the moving averages and MACD signals.
Momentum Analysis:
- RSI: The Relative Strength Index has been fluctuating but generally staying within the neutral to overbought territory.
- Stochastic Oscillator: Both %K and %D have been in the overbought zone, indicating a strong bullish momentum.
- Williams %R: The Williams %R has been consistently in the oversold region, suggesting a potential reversal.
Key Observation: The momentum indicators signal a strong bullish sentiment for FEPI, with the stochastic oscillator showing significant buying pressure.
Volatility Analysis:
- Bollinger Bands: The Bollinger Bands have been narrowing, indicating decreasing volatility in the stock price.
- Bollinger %B: The %B indicator has been fluctuating within a narrow range, suggesting a period of consolidation.
- Average True Range (ATR): The ATR has been decreasing, further confirming the reduced volatility.
Key Observation: The volatility indicators point towards a consolidation phase for FEPI, with the stock price likely to trade within a tight range.
Volume Analysis:
- On-Balance Volume (OBV): The OBV has shown mixed signals, with fluctuations in volume accumulation.
- Chaikin Money Flow (CMF): The CMF has been positive but declining, indicating a potential decrease in buying pressure.
Key Observation: The volume indicators suggest a neutral to slightly bearish sentiment, with the OBV showing indecision in volume accumulation.
Conclusion:
Based on the comprehensive analysis of trend, momentum, volatility, and volume indicators, the overall outlook for FEPI in the next few days is as follows:
- Trend: Upward trend based on moving averages and MACD.
- Momentum: Strongly bullish momentum indicated by the stochastic oscillator.
- Volatility: Consolidation phase with reduced volatility.
- Volume: Neutral to slightly bearish sentiment based on OBV and CMF.
Final Verdict:
Considering the collective analysis, the next few days for FEPI are likely to see a continuation of the bullish trend with some consolidation due to reduced volatility. Traders may consider entering long positions with caution, keeping an eye on key support and resistance levels for potential profit-taking opportunities.