Technical Analysis of FEUS 2024-05-10
Overview:
In analyzing the technical indicators for FEUS over the last 5 days, we will delve into the trend, momentum, volatility, and volume indicators to provide a comprehensive outlook on the possible stock price movement in the coming days. By examining these key aspects, we aim to offer valuable insights and predictions to guide your investment decisions.
Trend Analysis:
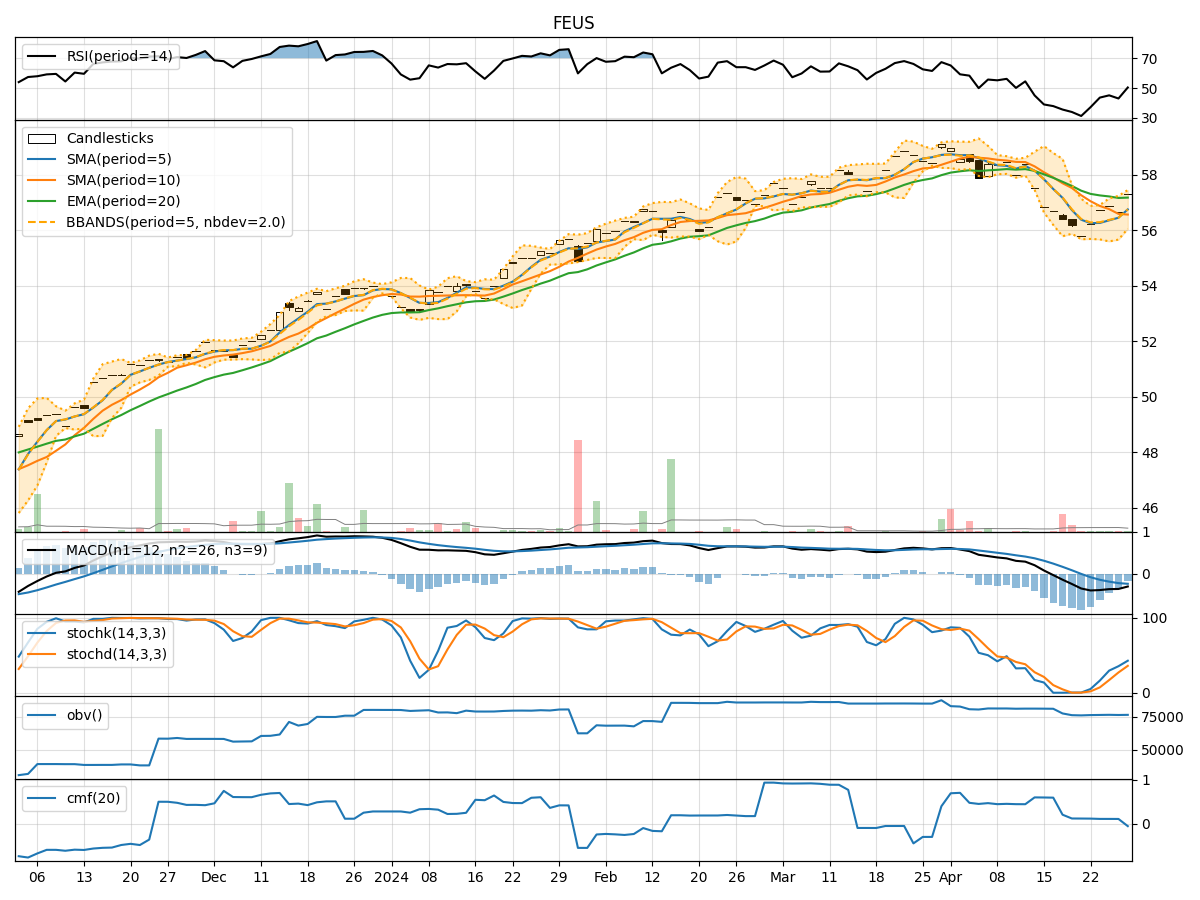
- Moving Averages (MA): The 5-day MA has been consistently above the 10-day SMA, indicating a short-term bullish trend. The EMA(20) has shown an upward trajectory, suggesting a positive momentum in the stock price.
- MACD: The MACD line has been above the signal line for the past 5 days, with both lines trending upwards. This signals a bullish momentum in the stock.
- Conclusion: The trend indicators point towards an upward movement in the stock price.
Momentum Analysis:
- RSI: The RSI has been consistently above 50, indicating strong buying momentum in the stock.
- Stochastic Oscillator: Both %K and %D have been in the overbought territory, suggesting a strong bullish momentum.
- Conclusion: The momentum indicators suggest a bullish sentiment in the stock.
Volatility Analysis:
- Bollinger Bands (BB): The stock price has been trading within the upper Bollinger Band, indicating an increased volatility but also a potential continuation of the uptrend.
- Conclusion: The volatility indicators suggest a potential continuation of the current trend with increased price fluctuations.
Volume Analysis:
- On-Balance Volume (OBV): The OBV has been relatively stable over the past 5 days, indicating a balance between buying and selling pressure.
- Chaikin Money Flow (CMF): The CMF has been negative, suggesting a slight distribution phase.
- Conclusion: The volume indicators show a neutral stance with no clear direction in buying or selling pressure.
Overall Conclusion:
Based on the analysis of trend, momentum, volatility, and volume indicators, the overall outlook for FEUS in the next few days is bullish. The trend indicators suggest an upward movement, supported by strong momentum signals. Although volatility is present, it aligns with the bullish trend. The volume indicators, while neutral, do not contradict the bullish sentiment.
Recommendation:
Considering the collective strength of the technical indicators, it is advisable to consider buying FEUS in the coming days. However, it is essential to monitor the price action closely and set appropriate stop-loss levels to manage risk effectively.
Disclaimer:
Remember that technical analysis is not a guaranteed predictor of future price movements, and other fundamental factors can influence stock prices. It is crucial to conduct thorough research and consider multiple indicators before making any investment decisions. Consulting with a financial advisor is recommended for personalized guidance tailored to your investment goals and risk tolerance.