Technical Analysis of FEUZ 2024-05-10
Overview:
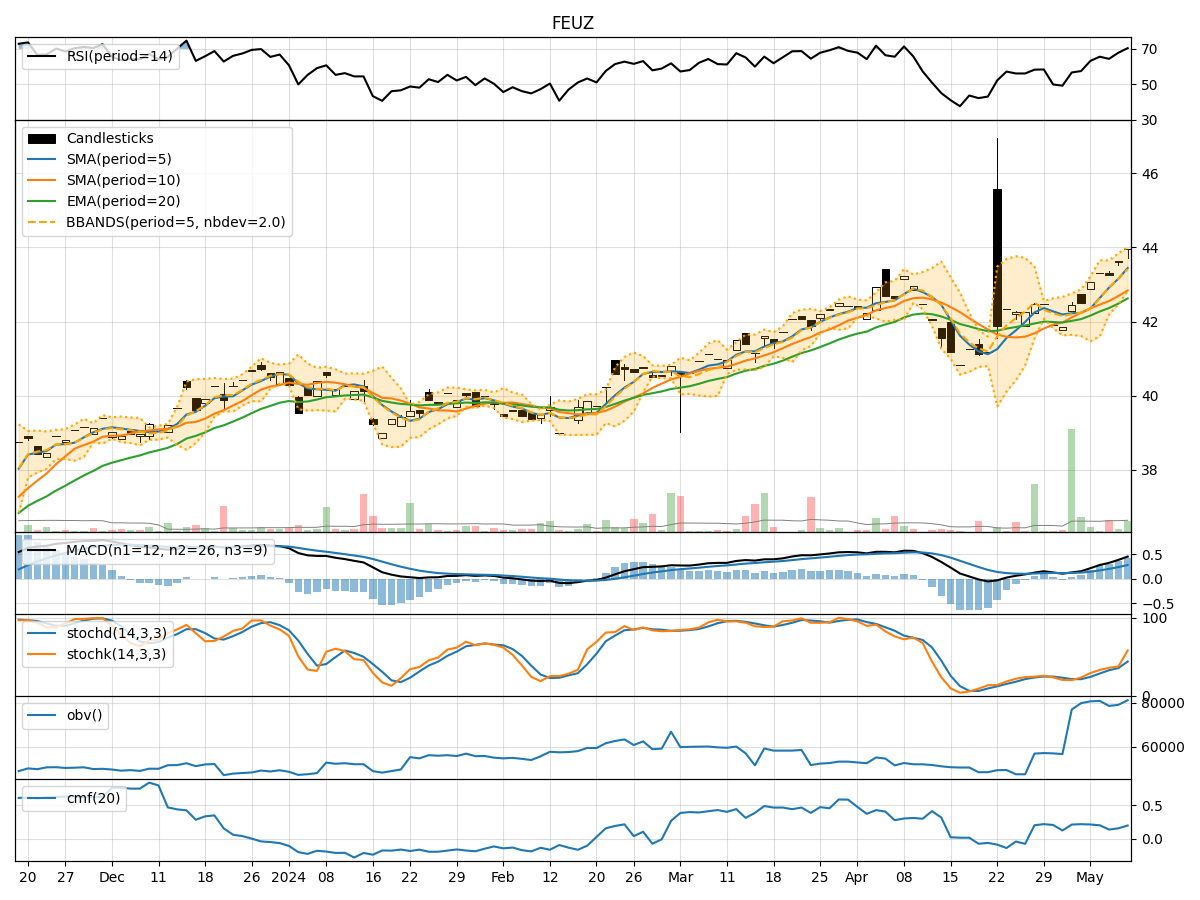
In analyzing the technical indicators for FEUZ over the last 5 days, we will delve into the trend, momentum, volatility, and volume indicators to provide a comprehensive outlook on the possible stock price movement in the coming days. By examining these key aspects, we aim to offer valuable insights and predictions to guide your investment decisions.
Trend Analysis:
- Moving Averages (MA): The moving averages show a consistent uptrend over the past 5 days, with the closing price consistently above the short-term moving averages.
- MACD: The MACD indicator has been steadily increasing, indicating a strengthening bullish momentum.
- RSI: The RSI values have been in the overbought territory, suggesting a strong bullish sentiment in the market.
Key Observation: The trend indicators point towards a strong bullish trend in the stock.
Momentum Analysis:
- Stochastic Oscillator: The stochastic oscillator is in the overbought zone, indicating a potential reversal or consolidation in the near future.
- Williams %R (WillR): The Williams %R is at extreme levels, suggesting a possible pullback or correction.
Key Observation: The momentum indicators signal a potential reversal or consolidation in the stock price.
Volatility Analysis:
- Bollinger Bands (BB): The Bollinger Bands have been widening, indicating increased volatility in the stock price.
- Average True Range (ATR): The ATR values have been relatively stable, suggesting consistent volatility levels.
Key Observation: Volatility in the stock has increased over the past few days.
Volume Analysis:
- On-Balance Volume (OBV): The OBV has shown a mixed trend, with fluctuations in volume accumulation.
- Chaikin Money Flow (CMF): The CMF values have been positive, indicating buying pressure in the stock.
Key Observation: The volume indicators suggest mixed signals in terms of volume accumulation.
Conclusion:
Based on the analysis of the technical indicators, the stock is currently in a strong bullish trend with increased volatility and mixed volume signals. However, the momentum indicators hint at a potential reversal or consolidation in the near future. Therefore, it is recommended to exercise caution and closely monitor the stock price for signs of a reversal or continuation of the bullish trend.
Recommendation:
- Short-Term: Expect a possible consolidation or pullback in the stock price due to overbought momentum indicators.
- Long-Term: The overall trend remains bullish, so consider opportunities to enter or add to positions on pullbacks for potential long-term gains.
Always remember to conduct further research and consider fundamental factors before making any investment decisions.