Technical Analysis of FEX 2024-05-10
Overview:
In analyzing the technical indicators for FEX stock over the last 5 days, we will delve into the trend, momentum, volatility, and volume indicators to provide a comprehensive outlook on the possible stock price movement in the coming days. By examining these key indicators, we aim to offer valuable insights and predictions to guide your investment decisions.
Trend Indicators:
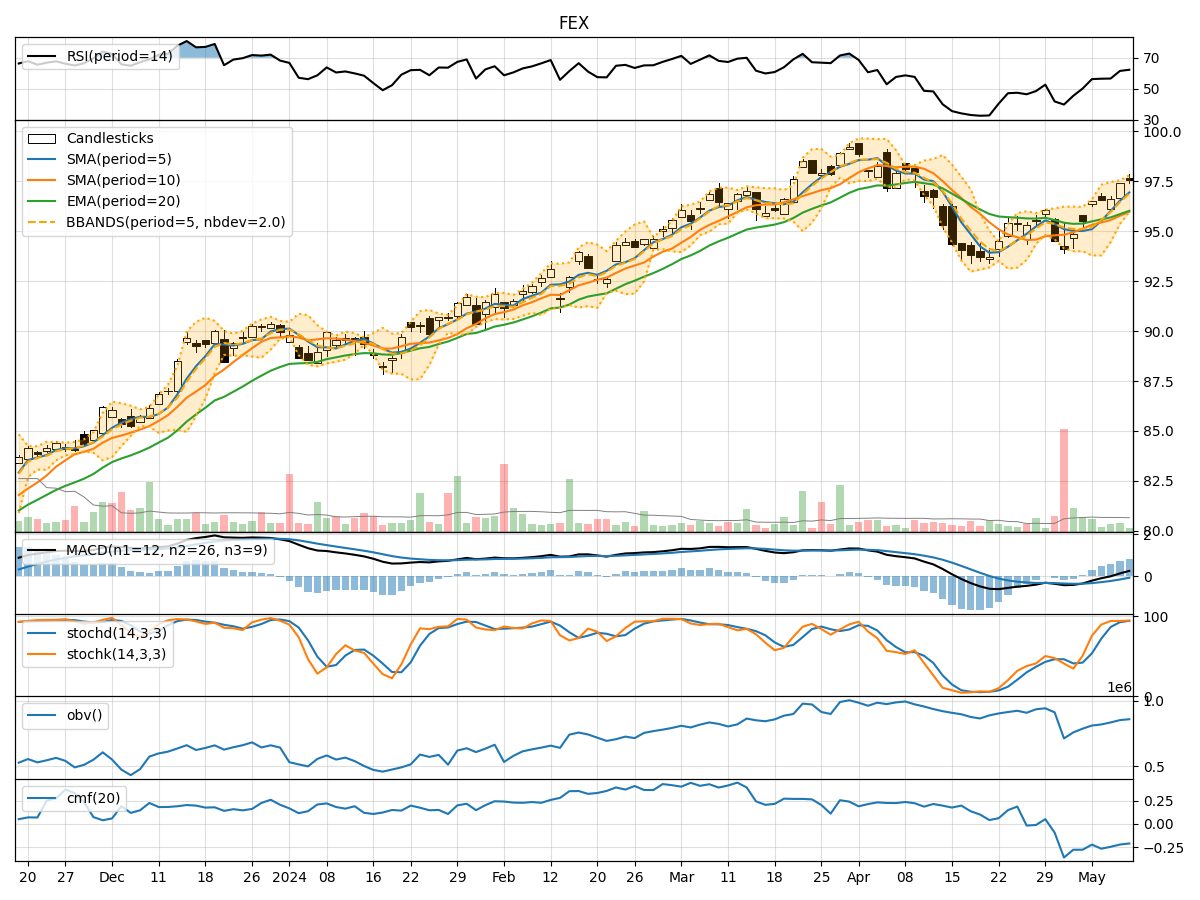
- Moving Averages (MA): The 5-day Moving Average (MA) has been consistently above the Simple Moving Average (SMA) and Exponential Moving Average (EMA), indicating a bullish trend.
- MACD: The MACD line has been above the signal line, with both lines showing an upward trend, suggesting bullish momentum.
- MACD Histogram: The MACD Histogram has been increasing, indicating strengthening bullish momentum.
Momentum Indicators:
- RSI: The Relative Strength Index (RSI) has been in the neutral to slightly overbought territory, suggesting a balanced momentum.
- Stochastic Oscillator: Both %K and %D lines of the Stochastic Oscillator have been in the overbought zone, indicating a potential reversal or consolidation.
- Williams %R: The Williams %R has been fluctuating around the oversold and overbought levels, signaling indecision in momentum.
Volatility Indicators:
- Bollinger Bands: The stock price has been trading within the Bollinger Bands, with the bands widening slightly, indicating increased volatility.
- Bollinger %B: The %B indicator has been hovering around the middle range, suggesting a neutral stance in terms of volatility.
Volume Indicators:
- On-Balance Volume (OBV): The OBV has shown a slight increase over the last 5 days, indicating some accumulation by investors.
- Chaikin Money Flow (CMF): The CMF has been negative, suggesting outflow of money from the stock.
Key Observations and Opinions:
- Trend: The trend indicators point towards a strong bullish sentiment in the stock.
- Momentum: Momentum indicators show a mix of overbought and oversold conditions, indicating a potential reversal or consolidation.
- Volatility: Volatility has slightly increased, but the %B indicator suggests a neutral stance.
- Volume: While OBV shows some accumulation, CMF indicates a negative money flow.
Conclusion:
Based on the analysis of the technical indicators, the stock is currently in an upward trend with bullish momentum. However, the overbought conditions in the momentum indicators and the negative money flow in volume indicators suggest a possible consolidation or pullback in the coming days. Investors should closely monitor the price action for signs of a reversal or continuation of the bullish trend.