Technical Analysis of FFEB 2024-05-10
Overview:
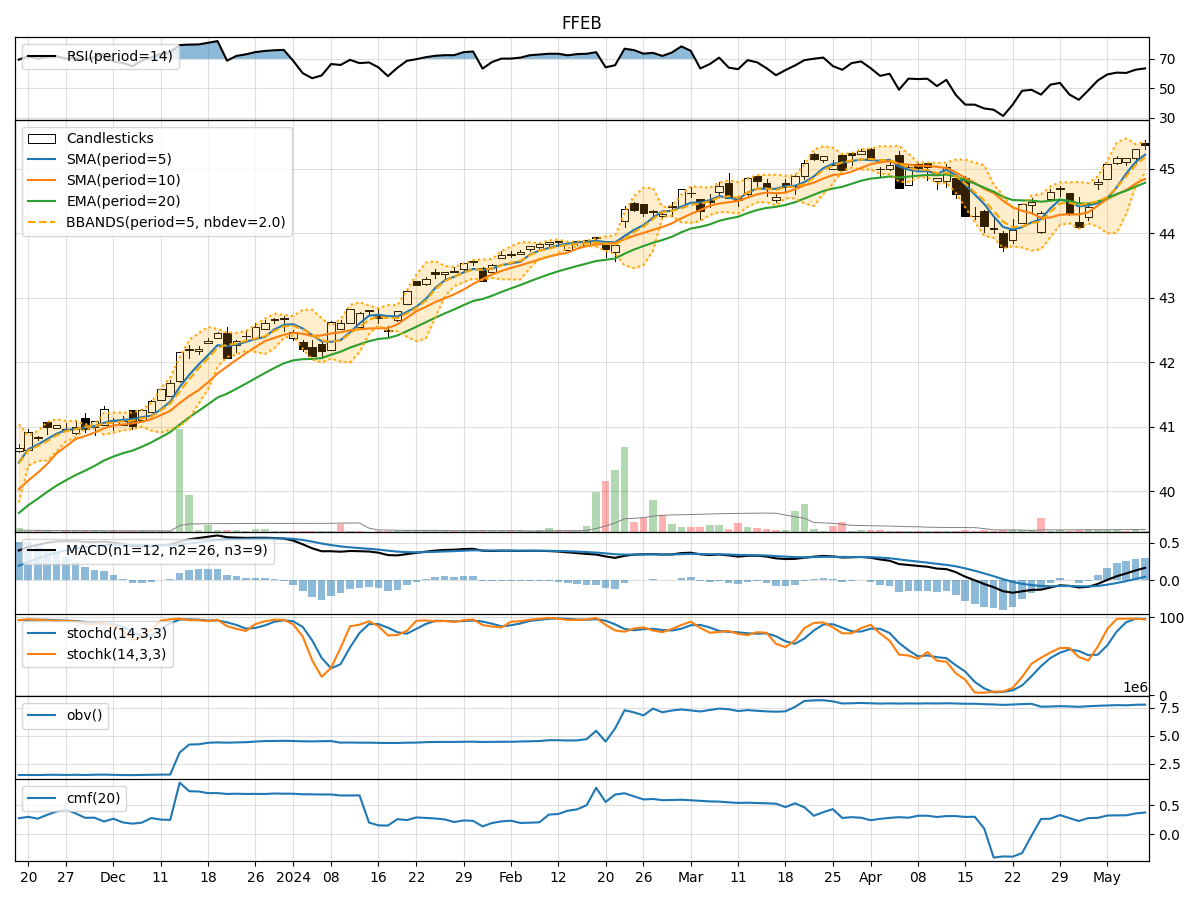
In analyzing the technical indicators for FFEB stock over the last 5 days, we will delve into the trend, momentum, volatility, and volume indicators to provide a comprehensive outlook on the possible stock price movement in the coming days.
Trend Indicators:
- Moving Averages (MA): The 5-day MA has been consistently above the closing prices, indicating a short-term uptrend.
- MACD: The MACD line has been positive and increasing, suggesting bullish momentum.
- MACD Histogram: The histogram has been rising, indicating strengthening bullish momentum.
Key Observation: The trend indicators point towards a bullish sentiment in the stock price movement.
Momentum Indicators:
- RSI: The RSI has been trending upwards, indicating increasing buying pressure.
- Stochastic Oscillator: Both %K and %D have been in overbought territory, suggesting a strong bullish momentum.
- Williams %R: The indicator has been consistently in oversold territory, signaling a potential reversal.
Key Observation: Momentum indicators reflect a strong bullish sentiment in the stock.
Volatility Indicators:
- Bollinger Bands: The bands have been narrowing, indicating decreasing volatility.
- Bollinger %B: The %B has been hovering around 0.8, suggesting the stock is trading near the upper band.
Key Observation: Volatility indicators suggest a consolidation phase in the stock price.
Volume Indicators:
- On-Balance Volume (OBV): The OBV has been trending upwards, indicating accumulation by investors.
- Chaikin Money Flow (CMF): The CMF has been positive, signaling buying pressure.
Key Observation: Volume indicators support the bullish sentiment in the stock.
Conclusion:
Based on the analysis of the technical indicators, the next few days' possible stock price movement for FFEB is likely to be upward. The trend indicators, momentum indicators, and volume indicators all point towards a bullish outlook. However, the volatility indicators suggest a consolidation phase, which could lead to a temporary pause in the upward movement. Overall, the stock shows strong bullish momentum with potential for further upside. Investors may consider entering long positions with appropriate risk management strategies in place.