Technical Analysis of FFLC 2024-05-10
Overview:
In analyzing the technical indicators for FFLC over the last 5 days, we will delve into the trend, momentum, volatility, and volume indicators to provide a comprehensive outlook on the possible stock price movement in the coming days. By examining these key indicators, we aim to offer valuable insights and predictions for informed decision-making.
Trend Analysis:
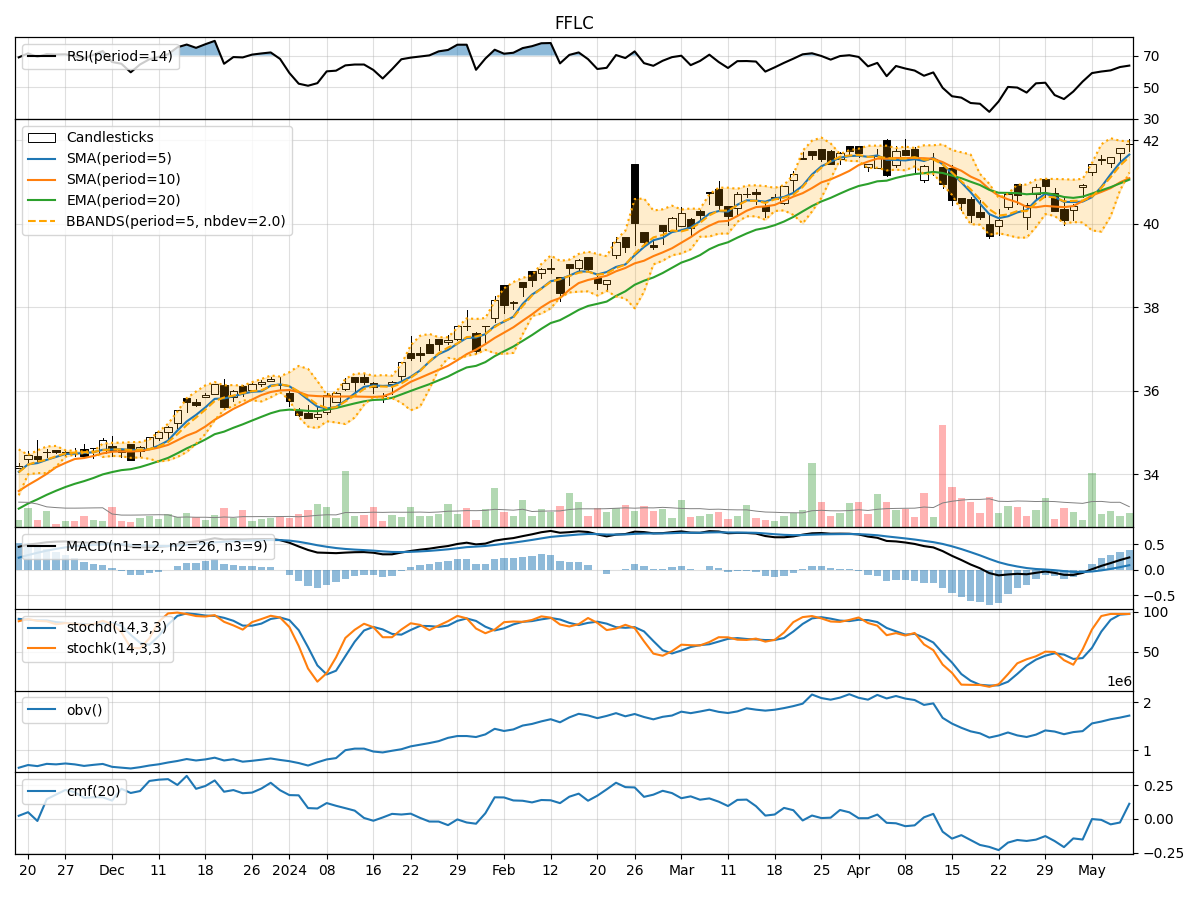
- Moving Averages (MA): The 5-day MA has been consistently above the closing prices, indicating a bullish trend.
- MACD: The MACD line has been trending upwards, with the MACD histogram showing positive values, suggesting bullish momentum.
Key Observation: The trend indicators suggest a bullish sentiment in the stock price movement.
Momentum Analysis:
- RSI: The RSI values have been increasing, indicating strengthening momentum.
- Stochastic Oscillator: Both %K and %D values have been high, suggesting strong buying pressure.
Key Observation: Momentum indicators reflect a bullish momentum in the stock.
Volatility Analysis:
- Bollinger Bands (BB): The bands have been narrowing, indicating decreasing volatility.
Key Observation: Volatility indicators suggest a decreasing volatility in the stock price.
Volume Analysis:
- On-Balance Volume (OBV): The OBV values have been increasing, indicating accumulation.
- Chaikin Money Flow (CMF): The CMF values have been negative, suggesting some selling pressure.
Key Observation: Volume indicators show a mixed sentiment with accumulation but some selling pressure.
Conclusion:
Based on the analysis of the technical indicators, the stock of FFLC is likely to experience upward movement in the coming days. The trend indicators, momentum indicators, and decreasing volatility all point towards a bullish sentiment. Although there is some selling pressure indicated by the volume indicators, the overall picture suggests a potential increase in stock price.
Recommendation:
Considering the bullish trend and momentum, investors may consider buying or holding onto their positions in FFLC. It is essential to monitor the volume indicators closely to gauge any potential shifts in market sentiment. Additionally, setting appropriate stop-loss levels can help manage risk in case of unexpected price movements.
By combining the insights from trend, momentum, volatility, and volume indicators, investors can make well-informed decisions to capitalize on the potential upward movement in FFLC stock.