Technical Analysis of FFLG 2024-05-10
Overview:
In analyzing the technical indicators for FFLG over the last 5 days, we will delve into the trend, momentum, volatility, and volume indicators to provide a comprehensive outlook on the possible stock price movement in the coming days. By examining these key aspects, we aim to offer valuable insights and recommendations for potential investors.
Trend Indicators:
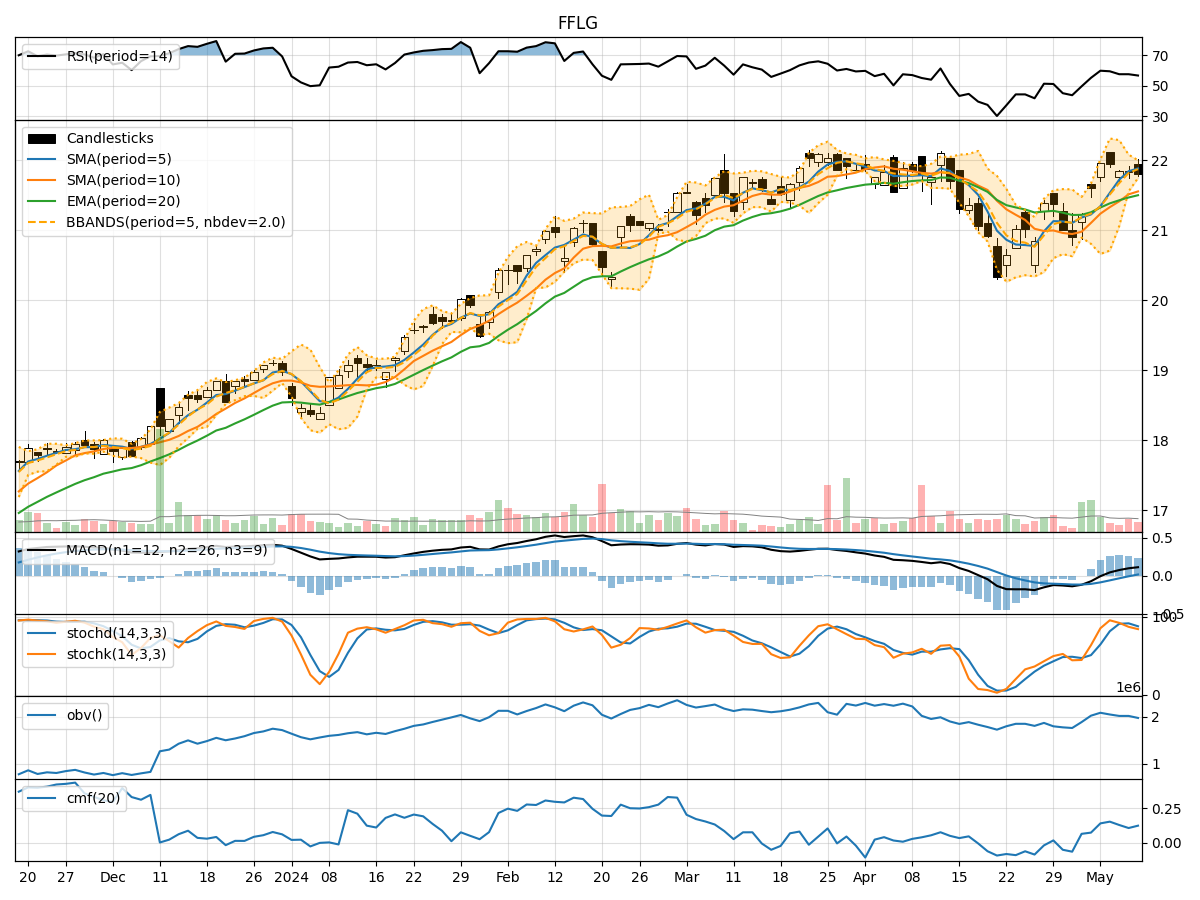
- Moving Averages (MA): The 5-day MA has been consistently above the closing prices, indicating a bullish trend.
- MACD: The MACD line has been above the signal line for the past 5 days, suggesting a bullish momentum.
- EMA: The exponential moving average has been trending upwards, supporting the bullish sentiment.
Momentum Indicators:
- RSI: The RSI has been fluctuating around the 50 level, indicating a neutral momentum.
- Stochastic Oscillator: Both %K and %D have been gradually decreasing, signaling a potential reversal in momentum.
- Williams %R: The indicator has been in oversold territory, suggesting a possible bullish reversal.
Volatility Indicators:
- Bollinger Bands (BB): The bands have been narrowing, indicating decreasing volatility.
- BB %B: The %B indicator has been hovering around the middle, reflecting a neutral stance on volatility.
Volume Indicators:
- On-Balance Volume (OBV): The OBV has been declining, indicating selling pressure in the stock.
- Chaikin Money Flow (CMF): The CMF has been relatively stable, suggesting a balance between buying and selling pressure.
Key Observations:
- The trend indicators point towards a bullish sentiment with moving averages and MACD supporting upward momentum.
- Momentum indicators show a mixed signal with RSI neutral, stochastic oscillator hinting at a potential reversal, and Williams %R indicating a bullish opportunity.
- Volatility indicators suggest decreasing volatility, which could lead to a period of consolidation.
- Volume indicators reflect selling pressure as OBV declines, while CMF indicates a balanced market sentiment.
Conclusion:
Based on the analysis of the technical indicators, the next few days for FFLG could see sideways movement with a slight bullish bias. Traders may observe a period of consolidation as volatility decreases, but the overall trend remains positive. Investors should monitor key levels such as support and resistance to capitalize on potential price movements. It is advisable to wait for confirmation from multiple indicators before making significant trading decisions.