Technical Analysis of FFLS 2024-05-10
Overview:
In analyzing the technical indicators for FFLS over the last 5 days, we will delve into the trend, momentum, volatility, and volume indicators to provide a comprehensive assessment of the stock's potential price movement. By examining these key factors, we aim to offer valuable insights and predictions for the next few days.
Trend Analysis:
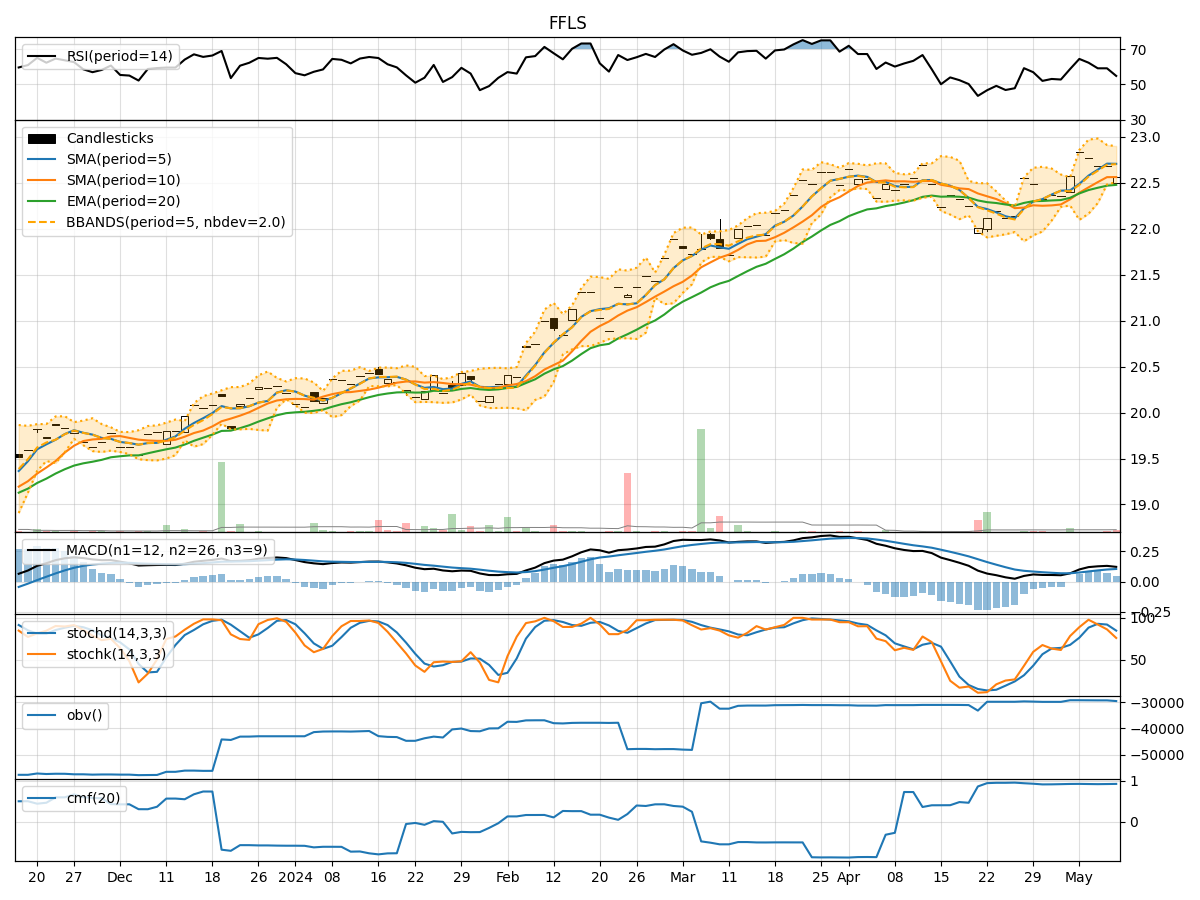
- Moving Averages (MA): The 5-day Moving Average (MA) has been consistently above the Simple Moving Average (SMA) and Exponential Moving Average (EMA), indicating a bullish trend.
- MACD: The MACD line has been above the signal line, with both lines showing an upward trend, suggesting positive momentum.
Momentum Analysis:
- RSI: The Relative Strength Index (RSI) has been declining but remains above the oversold threshold of 30, indicating a potential reversal in the near future.
- Stochastic Oscillator: Both %K and %D have been decreasing, signaling a bearish momentum.
Volatility Analysis:
- Bollinger Bands (BB): The stock price has been trading within the Bollinger Bands, with the bands narrowing, indicating decreasing volatility.
Volume Analysis:
- On-Balance Volume (OBV): The OBV has been relatively flat, suggesting a balance between buying and selling pressure.
- Chaikin Money Flow (CMF): The CMF has been positive, indicating accumulation of the stock.
Key Observations:
- The trend indicators suggest a bullish sentiment, supported by the moving averages and MACD.
- Momentum indicators show a mixed signal, with RSI hinting at a potential reversal while the Stochastic Oscillator indicates bearish momentum.
- Volatility has been decreasing, as shown by the narrowing Bollinger Bands.
- Volume indicators reflect a balanced buying and selling pressure, with a slight accumulation based on CMF.
Conclusion:
Based on the analysis of the technical indicators, the stock price of FFLS is likely to experience sideways movement in the next few days. The bullish trend indicated by moving averages and MACD may be offset by the bearish momentum suggested by the Stochastic Oscillator. The decreasing volatility and balanced volume further support the expectation of sideways movement. Traders should exercise caution and closely monitor key levels for potential breakout or reversal signals.
Recommendation:
- Short-term Traders: Consider range-bound strategies or wait for clearer signals before taking positions.
- Long-term Investors: Monitor for a potential trend reversal or breakout before making significant investment decisions.
By combining insights from trend, momentum, volatility, and volume indicators, traders and investors can make more informed decisions in navigating the market dynamics of FFLS.