Technical Analysis of FFND 2024-05-10
Overview:
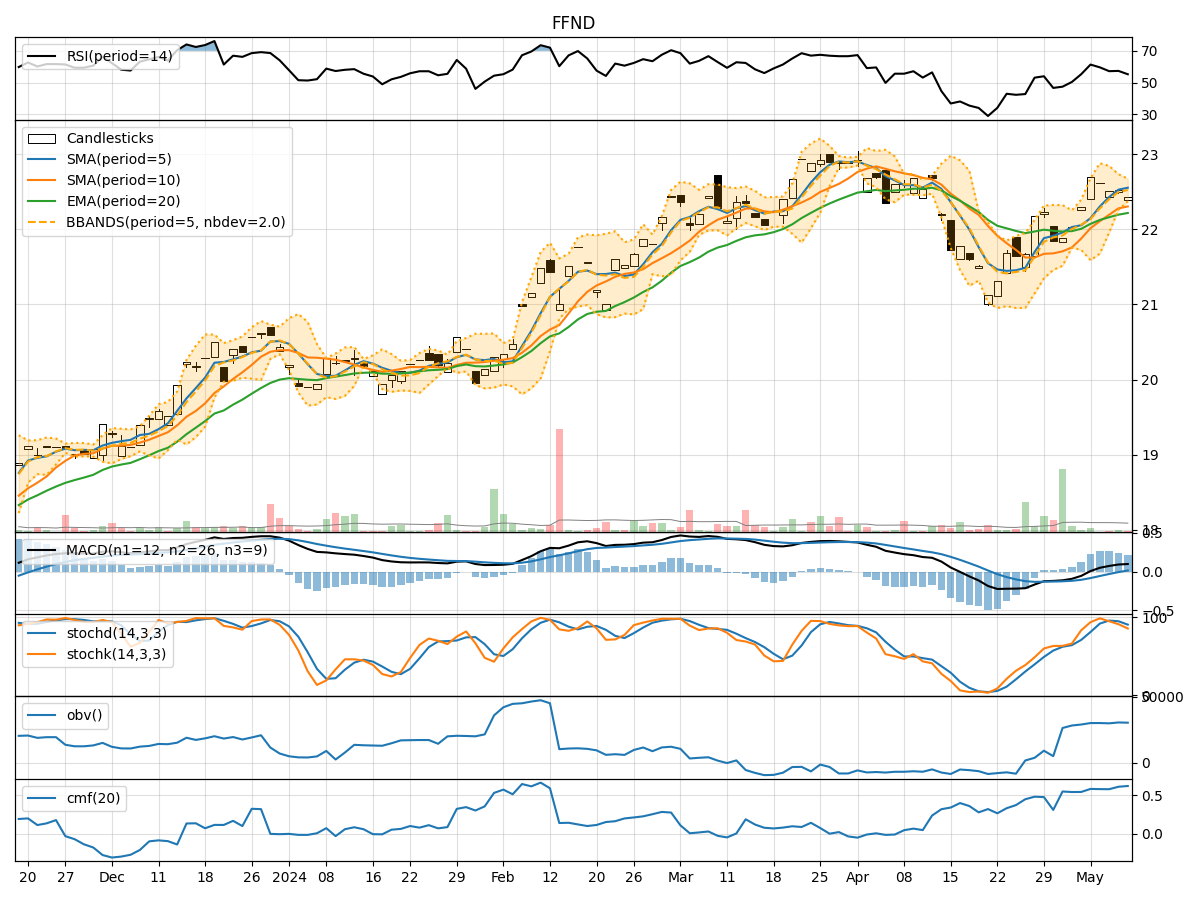
In analyzing the technical indicators for FFND over the last 5 days, we will delve into the trend, momentum, volatility, and volume indicators to provide a comprehensive outlook on the possible stock price movement in the coming days.
Trend Indicators:
- Moving Averages (MA): The 5-day MA has been consistently above the closing prices, indicating a short-term uptrend.
- MACD: The MACD line has been above the signal line, suggesting bullish momentum.
- RSI: The RSI has been fluctuating around the 50 level, indicating a neutral stance.
Momentum Indicators:
- Stochastic Oscillator: The stochastic indicators have been gradually decreasing, signaling a potential reversal in momentum.
- Williams %R: The Williams %R is in oversold territory, suggesting a possible buying opportunity.
Volatility Indicators:
- Bollinger Bands: The stock price has been trading within the Bollinger Bands, indicating a period of consolidation.
- Average True Range (ATR): The ATR has been relatively stable, suggesting consistent volatility levels.
Volume Indicators:
- On-Balance Volume (OBV): The OBV has been fluctuating, indicating mixed sentiment among investors.
- Chaikin Money Flow (CMF): The CMF has been positive, suggesting buying pressure in the market.
Key Observations:
- The trend indicators point towards a bullish sentiment in the short term.
- Momentum indicators show a potential reversal in momentum from overbought levels.
- Volatility indicators suggest a period of consolidation with stable volatility levels.
- Volume indicators reflect mixed sentiment among investors.
Conclusion:
Based on the analysis of the technical indicators, the next few days' possible stock price movement for FFND is likely to be sideways with a slight upward bias. Traders should monitor the stochastic indicators for a potential reversal in momentum and consider the support and resistance levels indicated by the Bollinger Bands. Additionally, keeping an eye on the OBV for any significant shifts in volume sentiment will be crucial in making informed trading decisions.