Technical Analysis of FFTY 2024-05-10
Overview:
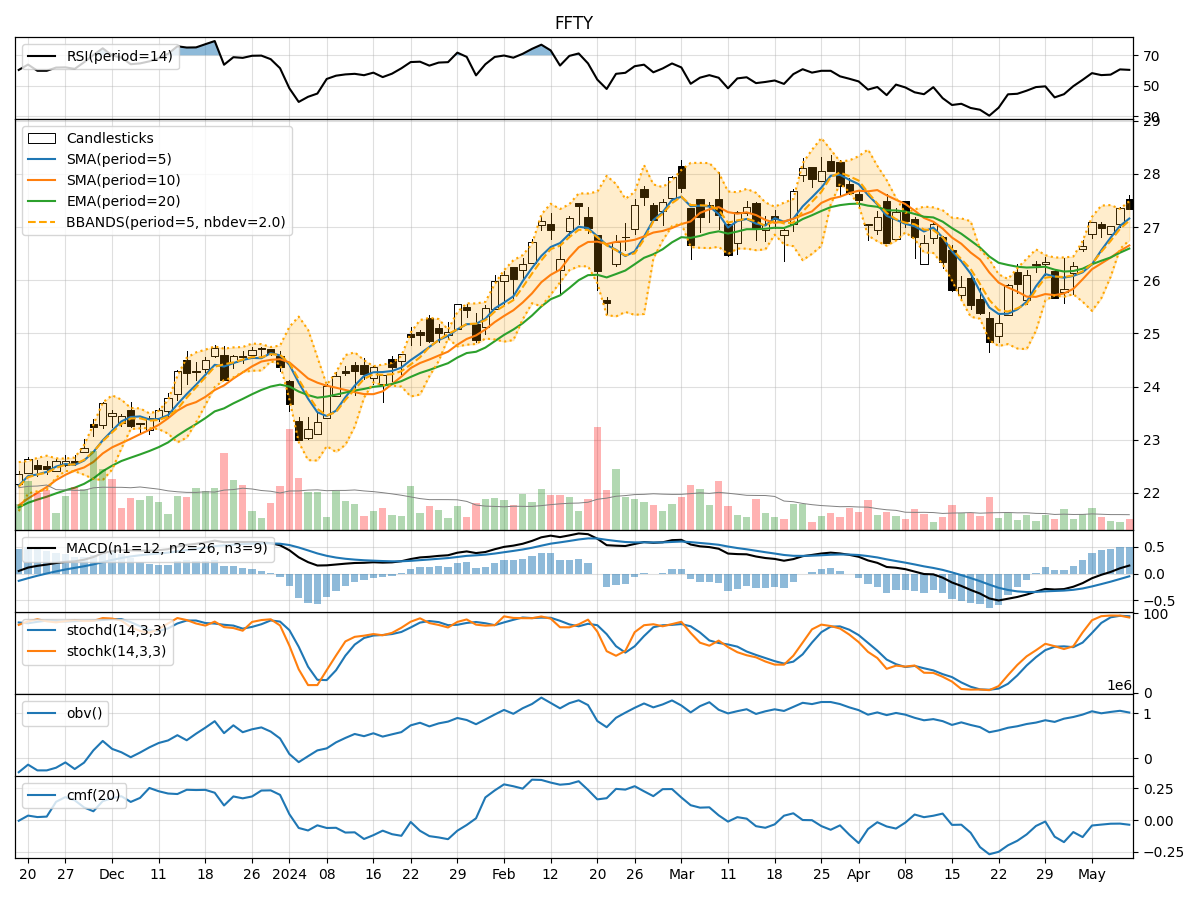
In analyzing the technical indicators for FFTY over the last 5 days, we will delve into the trend, momentum, volatility, and volume indicators to provide a comprehensive outlook on the possible stock price movement in the coming days. By examining these key indicators, we aim to offer valuable insights and predictions for potential investors.
Trend Indicators:
- Moving Averages (MA): The 5-day MA has been consistently above the closing prices, indicating a bullish trend.
- MACD: The MACD line has been positive, suggesting upward momentum in the stock price.
- MACD Histogram: The histogram has been increasing, indicating strengthening bullish momentum.
Momentum Indicators:
- RSI: The RSI has been in the neutral zone, suggesting neither overbought nor oversold conditions.
- Stochastic Oscillator: Both %K and %D have been in the overbought territory, indicating potential for a pullback.
- Williams %R: The indicator has been in the oversold region, signaling a possible reversal.
Volatility Indicators:
- Bollinger Bands (BB): The stock price has been trading within the bands, indicating stable volatility.
- BB %B: The %B has been fluctuating around the midline, suggesting a balanced market sentiment.
Volume Indicators:
- On-Balance Volume (OBV): The OBV has been negative, indicating distribution rather than accumulation.
- Chaikin Money Flow (CMF): The CMF has been negative, reflecting selling pressure in the stock.
Key Observations and Opinions:
- Trend: The stock is in an upward trend based on moving averages and MACD analysis.
- Momentum: The momentum indicators suggest a potential pullback due to overbought conditions.
- Volatility: Volatility has been stable, indicating a lack of significant price fluctuations.
- Volume: The negative OBV and CMF imply bearish sentiment and selling pressure in the stock.
Conclusion:
Based on the analysis of the technical indicators, the next few days' possible stock price movement for FFTY is likely to experience a short-term pullback or consolidation. Investors should exercise caution as the stock may face resistance due to overbought conditions and selling pressure indicated by volume indicators. It is advisable to wait for a clearer signal or confirmation of a new trend direction before making any significant trading decisions.