Technical Analysis of FGM 2024-05-10
Overview:
In analyzing the technical indicators for FGM stock over the last 5 days, we will delve into the trend, momentum, volatility, and volume indicators to provide a comprehensive outlook on the possible stock price movement in the coming days. By examining these key indicators, we aim to offer valuable insights and predictions to guide your investment decisions.
Trend Analysis:
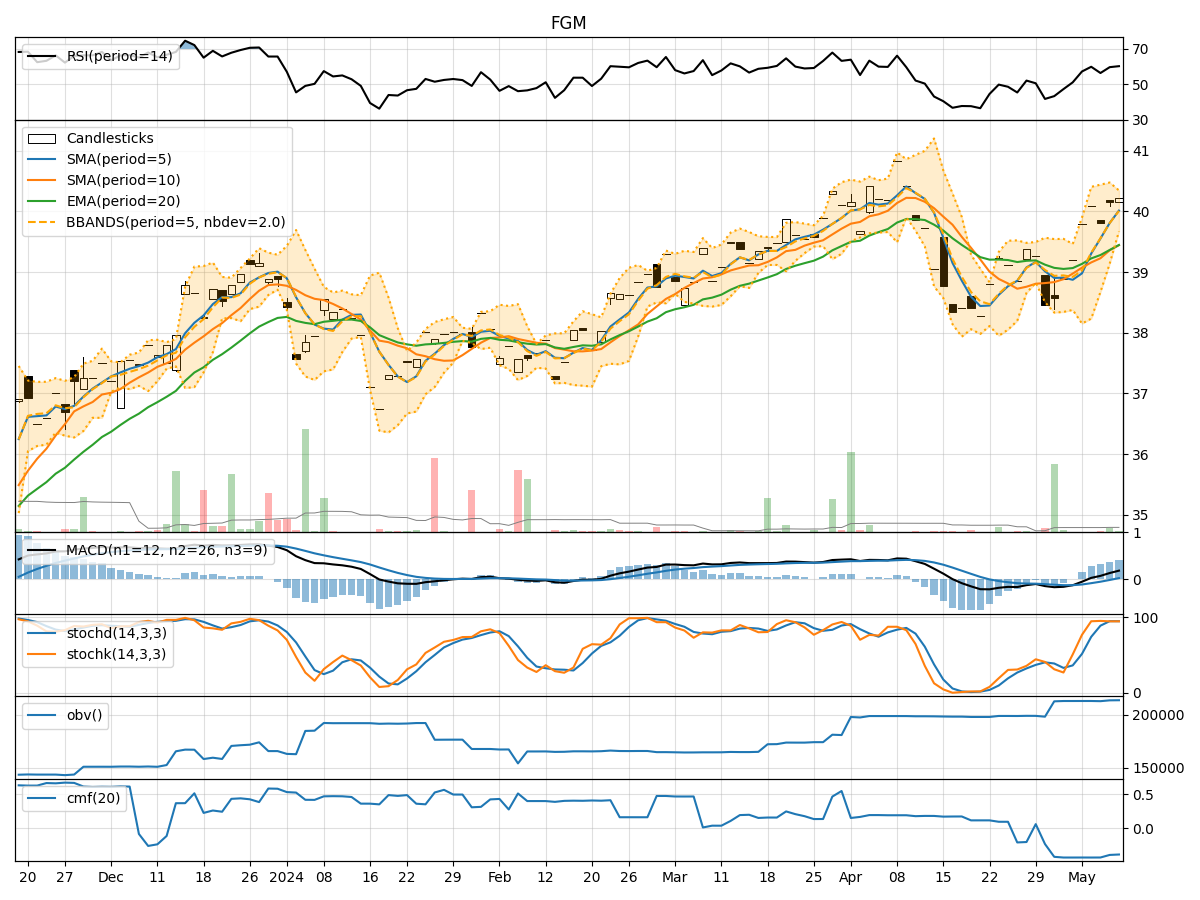
- Moving Averages (MA): The 5-day Moving Average (MA) has been consistently rising, indicating a bullish trend in the short term.
- MACD: The MACD line has been above the signal line for the past 5 days, suggesting a bullish momentum.
- EMA: The Exponential Moving Average (EMA) has also been trending upwards, supporting the bullish sentiment.
Momentum Analysis:
- RSI: The Relative Strength Index (RSI) has been hovering around 60-70, indicating a neutral to slightly bullish momentum.
- Stochastic Oscillator: Both %K and %D have been in the overbought zone, suggesting a potential reversal or consolidation.
- Williams %R: The Williams %R is close to the oversold territory, signaling a possible buying opportunity.
Volatility Analysis:
- Bollinger Bands: The Bollinger Bands have been narrowing, indicating decreasing volatility and a potential breakout in the near future.
- Bollinger %B: The %B indicator is hovering around 0.8, suggesting the stock is trading near the upper band.
Volume Analysis:
- On-Balance Volume (OBV): The OBV has shown a slight increase over the past 5 days, indicating accumulation by investors.
- Chaikin Money Flow (CMF): The CMF has been negative, suggesting selling pressure in the stock.
Key Observations:
- The trend indicators point towards a bullish sentiment in the short term.
- Momentum indicators show a mixed signal with potential for a reversal or consolidation.
- Volatility is decreasing, indicating a possible period of consolidation before a breakout.
- Volume indicators suggest a slight accumulation but with selling pressure still present.
Conclusion:
Based on the analysis of the technical indicators, the stock is likely to experience a period of consolidation in the coming days. While the trend remains bullish, the mixed signals from momentum indicators and the narrowing Bollinger Bands suggest a potential sideways movement before a breakout. Investors should closely monitor key support and resistance levels for potential entry or exit points.