Technical Analysis of FHLC 2024-05-10
Overview:
In analyzing the technical indicators for FHLC over the last 5 days, we will delve into the trend, momentum, volatility, and volume indicators to provide a comprehensive outlook on the possible stock price movement. By examining these key indicators, we aim to offer valuable insights and predictions for the upcoming days.
Trend Analysis:
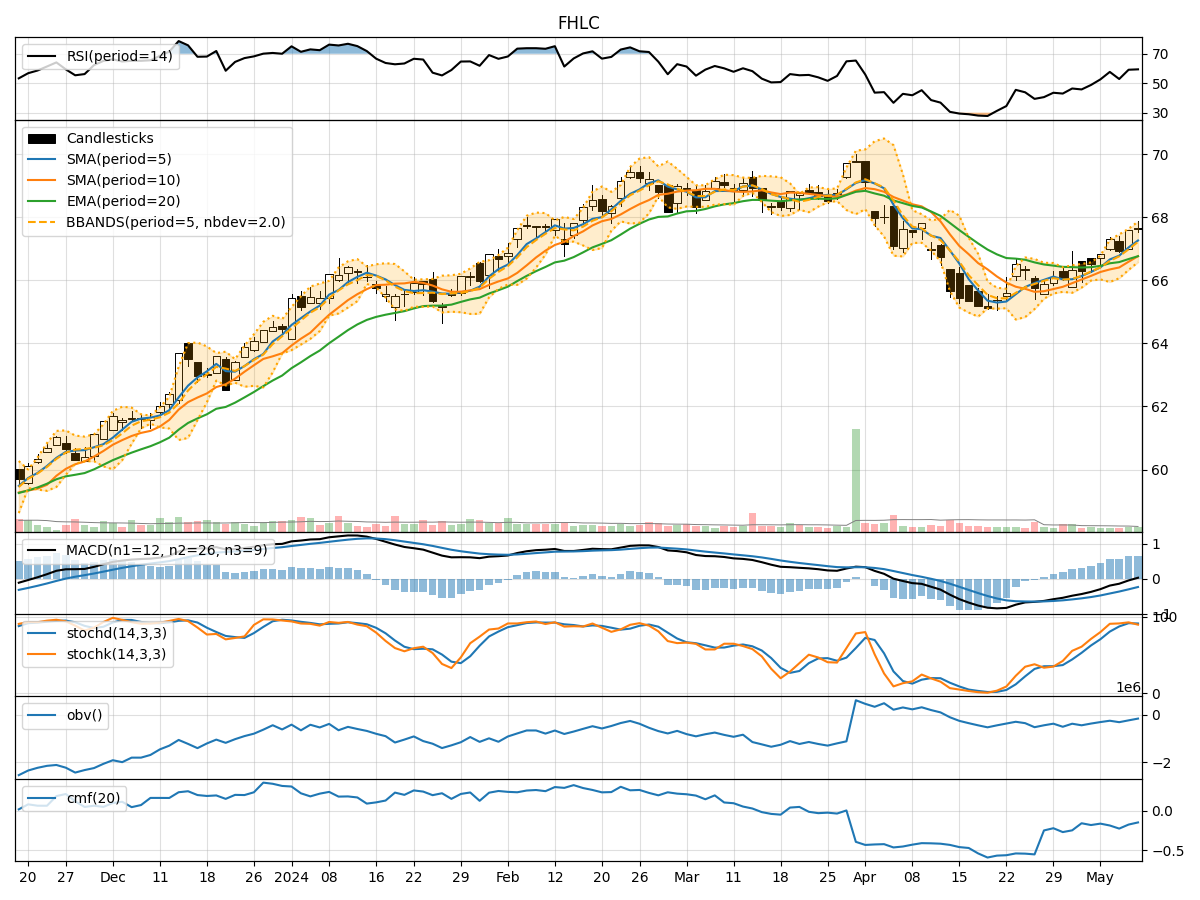
- Moving Averages (MA): The 5-day Moving Average (MA) has been consistently above the Simple Moving Average (SMA) and Exponential Moving Average (EMA), indicating a bullish trend.
- MACD: The Moving Average Convergence Divergence (MACD) has shown positive values, with the MACD line consistently above the Signal line, suggesting bullish momentum.
- RSI: The Relative Strength Index (RSI) has been fluctuating around the 50 level, indicating a neutral stance in terms of momentum.
Momentum Analysis:
- Stochastic Oscillator: The Stochastic Oscillator has been in the overbought region, suggesting a potential reversal or consolidation in the near term.
- Williams %R: The Williams %R indicator has shown mixed signals, moving between overbought and oversold levels, reflecting uncertainty in momentum.
Volatility Analysis:
- Bollinger Bands: The Bollinger Bands have shown narrowing bands, indicating decreasing volatility and a potential period of consolidation.
- Average True Range (ATR): ATR values have been relatively stable, suggesting a lack of significant price movements.
Volume Analysis:
- On-Balance Volume (OBV): The OBV indicator has shown mixed movements, reflecting indecision among market participants.
- Chaikin Money Flow (CMF): The CMF has been negative, indicating selling pressure in the stock.
Conclusion:
Based on the analysis of the technical indicators, the stock FHLC is likely to experience sideways movement in the next few days. The bullish trend indicated by moving averages and MACD may be limited by the overbought conditions highlighted by the Stochastic Oscillator. The neutral RSI and mixed momentum signals suggest a lack of clear direction. Additionally, the volatility indicators point towards a period of consolidation, while the negative CMF indicates selling pressure.
Therefore, it is recommended to exercise caution and closely monitor the price action for potential reversals or breakout opportunities. Traders may consider implementing range-bound strategies until a clearer trend emerges.