Technical Analysis of FHYS 2024-05-10
Overview:
In analyzing the technical indicators for FHYS over the last 5 days, we will delve into the trend, momentum, volatility, and volume indicators to provide a comprehensive outlook on the possible stock price movement. By examining these key aspects, we aim to offer valuable insights and predictions for the upcoming days.
Trend Analysis:
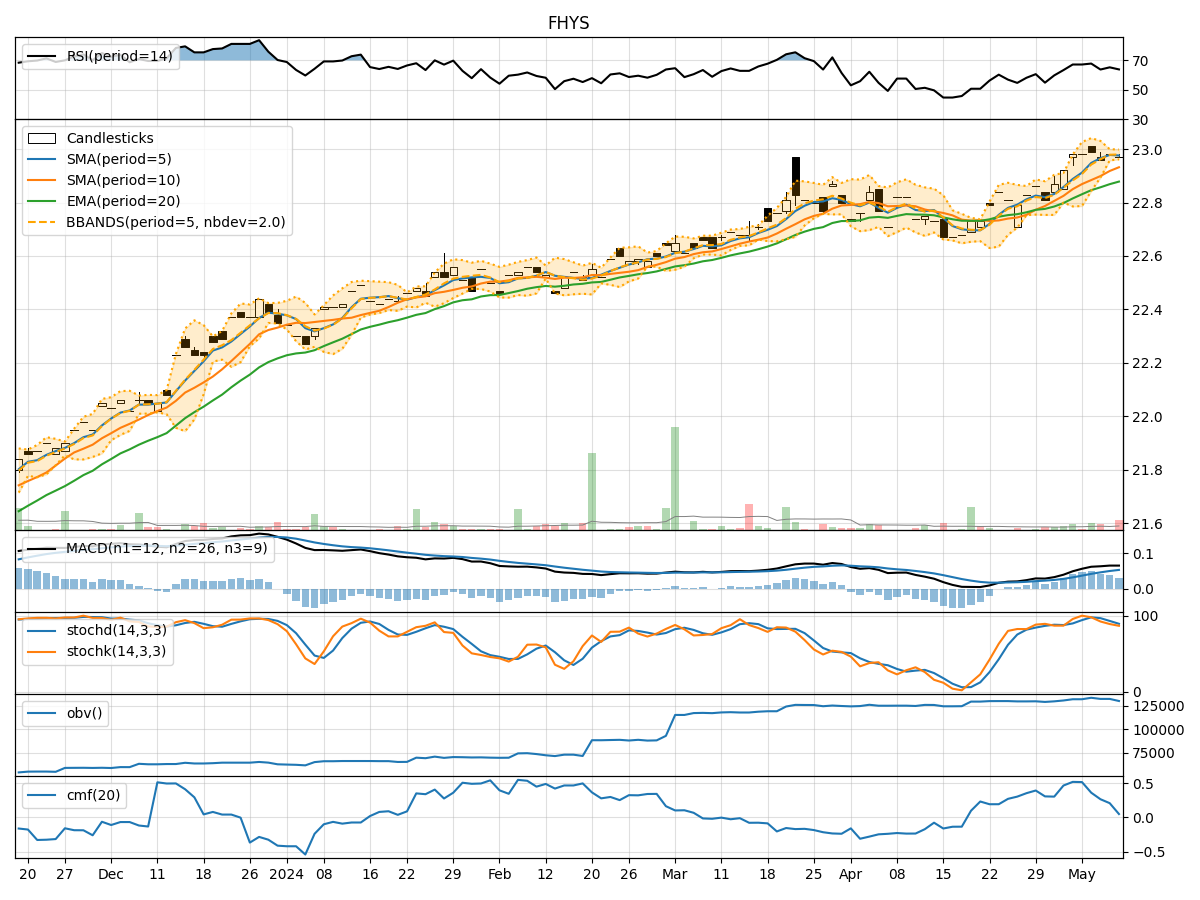
- Moving Averages (MA): The 5-day Moving Average (MA) has been consistently above the Simple Moving Average (SMA) and Exponential Moving Average (EMA), indicating a bullish trend.
- MACD: The MACD line has been above the signal line, with both lines showing an upward trend, suggesting positive momentum in the stock price.
- RSI: The Relative Strength Index (RSI) has been fluctuating around the 60-70 range, indicating a neutral stance in terms of overbought or oversold conditions.
Momentum Analysis:
- Stochastic Oscillator: The Stochastic Oscillator has been gradually decreasing but remains in the overbought territory, signaling a potential reversal or consolidation phase.
- Williams %R: The Williams %R indicator has been hovering around the -10 to -20 range, indicating a slightly overbought condition.
Volatility Analysis:
- Bollinger Bands (BB): The Bollinger Bands have been narrowing, suggesting a decrease in volatility and a possible period of consolidation.
- Average True Range (ATR): The ATR has shown a decline in volatility over the past few days, indicating a potential stabilization in price movements.
Volume Analysis:
- On-Balance Volume (OBV): The OBV has been relatively stable, indicating a balance between buying and selling pressure.
- Chaikin Money Flow (CMF): The CMF has been gradually declining, suggesting a decrease in buying pressure.
Conclusion:
Based on the analysis of the technical indicators, the stock of FHYS is likely to experience sideways movement in the next few days. The trend indicators point towards a bullish bias, supported by the positive MACD and moving averages. However, the momentum indicators suggest a potential consolidation or minor pullback due to the overbought conditions highlighted by the Stochastic Oscillator and Williams %R.
Moreover, the volatility indicators indicate a decrease in volatility, which aligns with the expected sideways movement. The volume indicators also suggest a balanced market sentiment with a slight decrease in buying pressure.
In conclusion, while the overall trend remains bullish, investors should be cautious of a possible consolidation phase in the near term. It is advisable to closely monitor key support and resistance levels for potential entry or exit points in FHYS stock.