Technical Analysis of FIAX 2024-05-10
Overview:
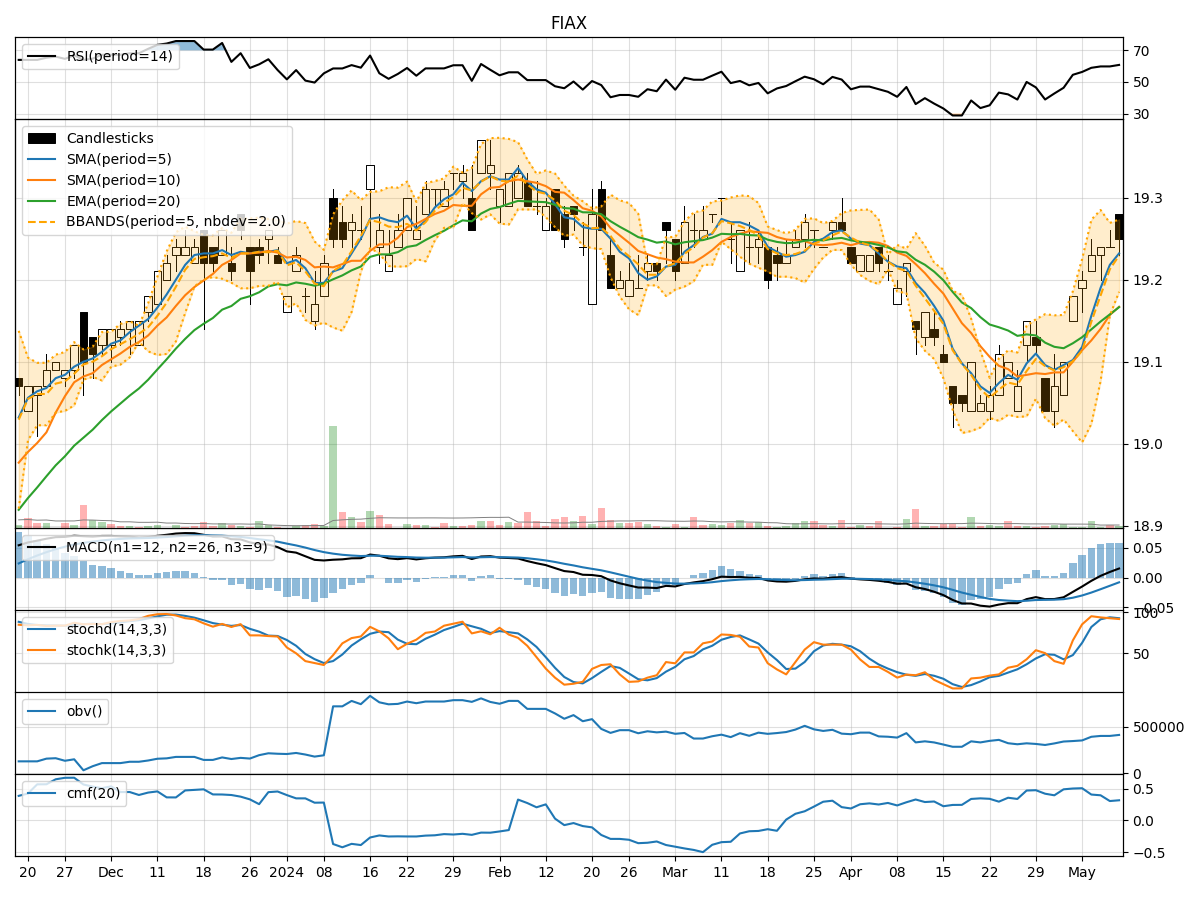
In analyzing the technical indicators for FIAX over the last 5 days, we will delve into the trend, momentum, volatility, and volume indicators to provide a comprehensive outlook on the possible stock price movement. By examining these key aspects, we aim to offer valuable insights and recommendations for potential future price action.
Trend Analysis:
- Moving Averages (MA): The 5-day moving average has been consistently above the simple moving average (SMA) and exponential moving average (EMA), indicating a short-term uptrend.
- MACD: The MACD line has been consistently above the signal line, with both lines showing an upward trend, suggesting bullish momentum.
- RSI: The Relative Strength Index (RSI) has been hovering around 60-61, indicating a neutral stance in terms of overbought or oversold conditions.
Key Observation: The trend indicators suggest a bullish sentiment in the short term.
Momentum Analysis:
- Stochastic Oscillator: Both %K and %D lines of the Stochastic Oscillator have been above 80, indicating overbought conditions.
- Williams %R: The Williams %R is consistently below -80, signaling an oversold market.
Key Observation: Momentum indicators suggest a potential pullback or consolidation in the near future.
Volatility Analysis:
- Bollinger Bands: The price has been trading within the Bollinger Bands, with the bands narrowing, indicating decreasing volatility.
- Average True Range (ATR): ATR has been relatively stable over the past few days, suggesting a lack of significant price fluctuations.
Key Observation: Volatility indicators point towards a period of consolidation or a potential decrease in volatility.
Volume Analysis:
- On-Balance Volume (OBV): The OBV has been showing a slight decline, indicating a decrease in buying pressure.
- Chaikin Money Flow (CMF): The CMF has been gradually decreasing, suggesting a weakening trend in money flow.
Key Observation: Volume indicators hint at a potential decrease in buying interest.
Conclusion:
Based on the analysis of the technical indicators, the stock price movement for FIAX in the next few days is likely to experience a period of consolidation or a minor pullback. The bullish trend indicated by the moving averages and MACD may face resistance due to overbought conditions highlighted by the momentum indicators. Additionally, decreasing volatility and weakening volume support the notion of a potential sideways movement or a slight downward correction in the stock price.
Recommendation: It is advisable for traders to exercise caution and consider waiting for clearer signals before making significant trading decisions. Monitoring key support and resistance levels along with any developments in market sentiment could provide valuable insights for navigating the upcoming price action.