Technical Analysis of FIBR 2024-05-10
Overview:
In analyzing the technical indicators for FIBR stock over the last 5 days, we will delve into the trends, momentum, volatility, and volume aspects to provide a comprehensive outlook on the possible stock price movement in the coming days. By examining key indicators such as moving averages, MACD, RSI, Bollinger Bands, and OBV, we aim to offer valuable insights and predictions for informed decision-making.
Trend Analysis:
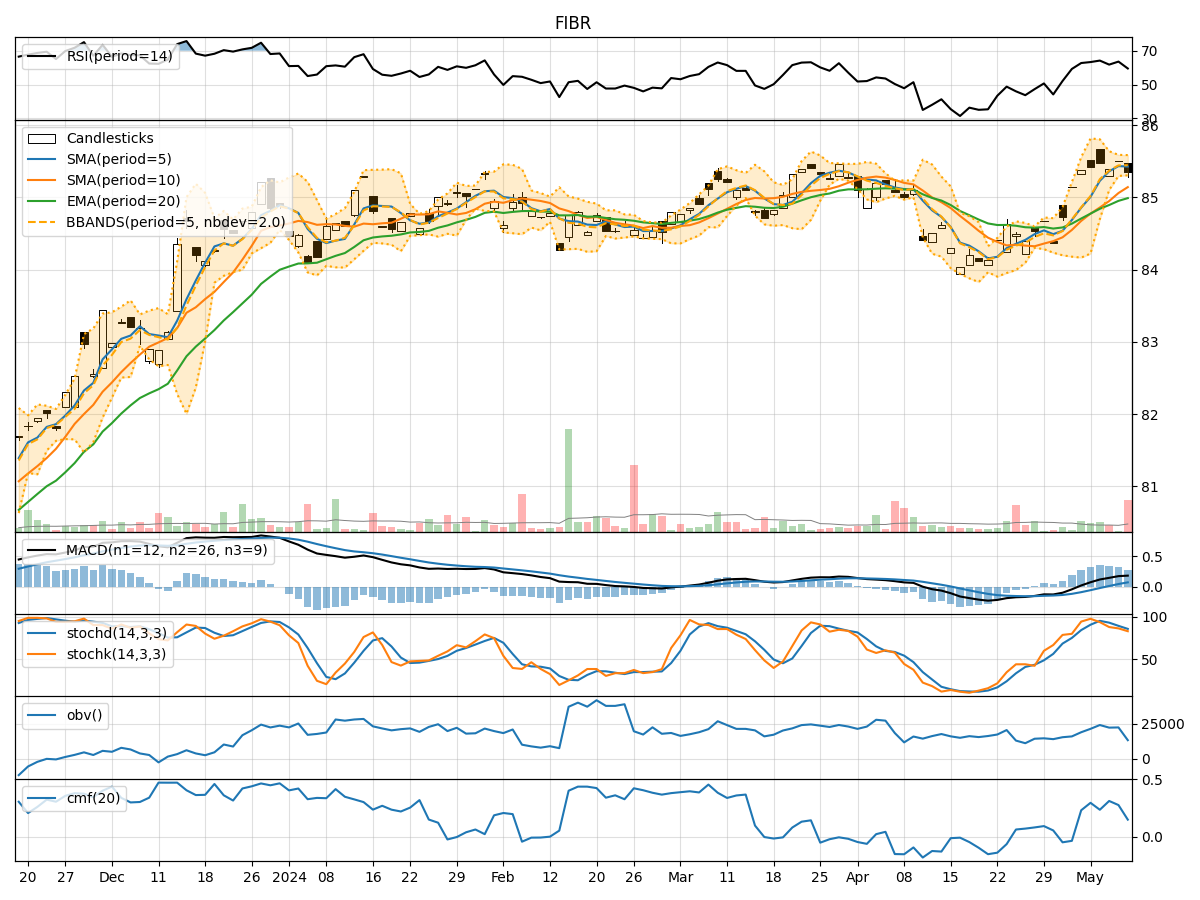
- Moving Averages (MA): The 5-day moving average has been consistently above the 10-day simple moving average, indicating a short-term bullish trend.
- MACD: The MACD line has been above the signal line for the past few days, suggesting positive momentum in the stock price.
Momentum Analysis:
- RSI: The Relative Strength Index (RSI) has been fluctuating around the 60-65 range, indicating a neutral momentum without being overbought or oversold.
- Stochastic Oscillator: Both %K and %D values have been gradually decreasing, signaling a potential bearish momentum.
Volatility Analysis:
- Bollinger Bands (BB): The stock price has been trading within the Bollinger Bands, with the bands narrowing slightly, indicating decreasing volatility.
Volume Analysis:
- On-Balance Volume (OBV): The OBV has shown mixed signals with fluctuations in volume, suggesting indecision among investors.
Key Observations:
- The stock is currently in a short-term bullish trend based on moving averages and MACD.
- Momentum indicators like RSI and Stochastic Oscillator are showing conflicting signals, with RSI indicating neutral momentum and Stochastic Oscillator hinting at a potential bearish trend.
- Volatility has been decreasing as per the Bollinger Bands, indicating a possible period of consolidation.
- Volume indicators like OBV reflect uncertainty in investor sentiment.
Conclusion:
Based on the analysis of technical indicators, the next few days for FIBR stock could see sideways movement with a slight bearish bias. The stock is likely to consolidate within a narrow range as volatility decreases. Investors should closely monitor key support and resistance levels to gauge potential breakout or breakdown scenarios. It is advisable to exercise caution and wait for clearer signals before making significant trading decisions.