Technical Analysis of FICS 2024-05-10
Overview:
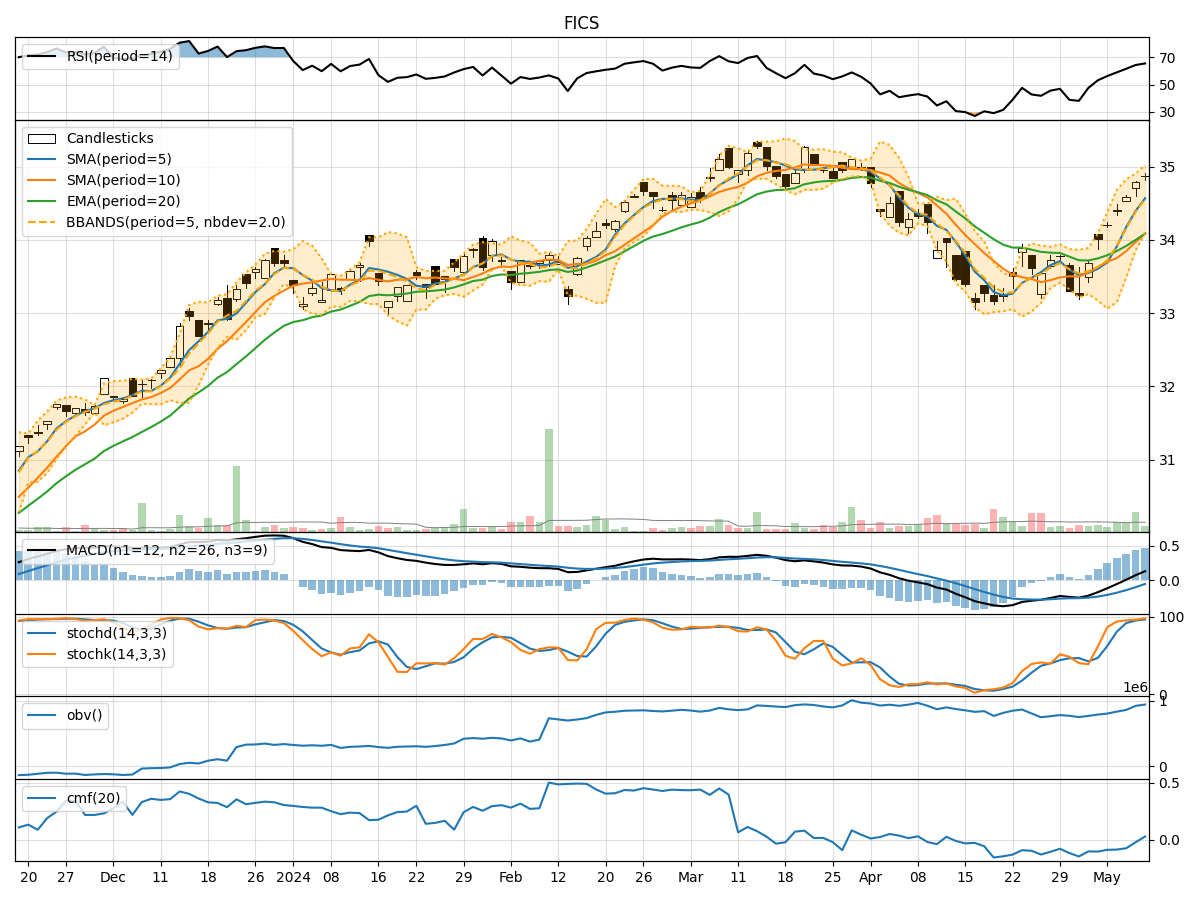
In the last 5 trading days, the stock price of FICS has shown a gradual increase, accompanied by increasing trading volumes. The trend indicators suggest a positive momentum with moving averages and MACD showing upward trends. Momentum indicators like RSI and Stochastic oscillators indicate overbought conditions but still have room for further upside. Volatility indicators show a narrowing Bollinger Band, indicating a potential breakout. Volume indicators like OBV and CMF are relatively stable, suggesting consistent buying pressure.
Trend Indicators:
- Moving Averages (MA): The 5-day MA is consistently above the longer-term SMAs, indicating a short-term bullish trend.
- MACD: The MACD line is above the signal line, indicating a bullish momentum.
- MACD Histogram: The histogram is positive and increasing, suggesting strengthening bullish momentum.
Momentum Indicators:
- RSI: The RSI is in the overbought territory but has not shown any signs of divergence, indicating strong buying pressure.
- Stochastic Oscillator: Both %K and %D lines are in the overbought zone, suggesting a potential pullback or consolidation.
- Williams %R: The indicator is in the oversold region, indicating a potential reversal.
Volatility Indicators:
- Bollinger Bands (BB): The bands are narrowing, suggesting a period of consolidation before a potential breakout.
- BB %B: The %B is hovering around 0.8, indicating a strong uptrend.
Volume Indicators:
- On-Balance Volume (OBV): The OBV has been steadily increasing, indicating accumulation by investors.
- Chaikin Money Flow (CMF): The CMF is negative but has shown signs of improvement, indicating a potential shift towards buying pressure.
Key Observations:
- The stock is in a strong uptrend based on moving averages and MACD.
- Momentum indicators suggest a temporary overbought condition, which might lead to a short-term pullback.
- Volatility indicators point towards a potential breakout after a period of consolidation.
- Volume indicators show consistent buying pressure, supporting the bullish bias.
Conclusion:
Based on the technical analysis of trend, momentum, volatility, and volume indicators, the next few days' possible stock price movement for FICS is upward with a potential short-term pullback or consolidation before a breakout. Traders should consider buying on dips or wait for a breakout confirmation for potential entry points. It is essential to monitor the momentum indicators for any signs of divergence or reversal in the bullish trend.