Technical Analysis of FIDU 2024-05-10
Overview:
In analyzing the technical indicators for FIDU over the last 5 days, we will delve into the trend, momentum, volatility, and volume indicators to provide a comprehensive outlook on the possible stock price movement in the coming days. By examining these key aspects, we aim to offer valuable insights and predictions to guide your investment decisions.
Trend Indicators:
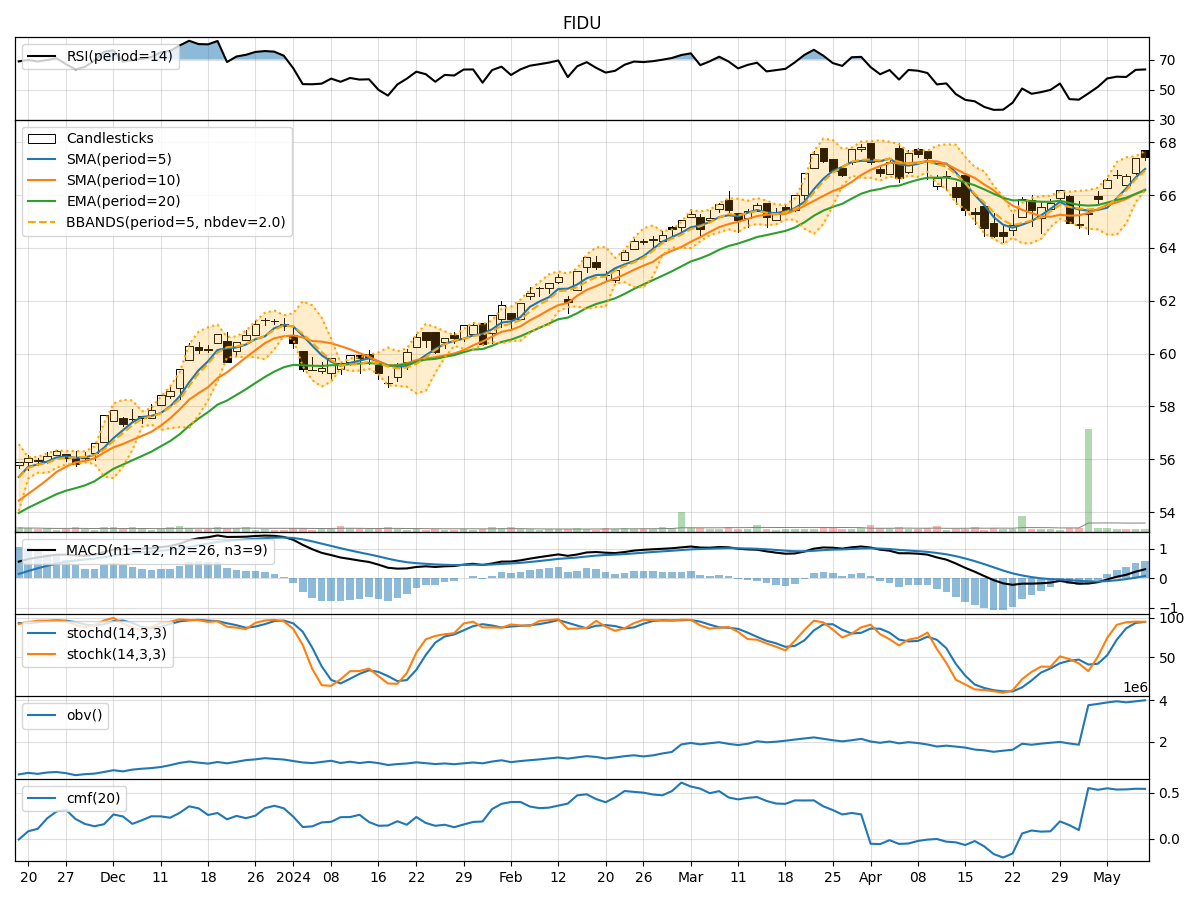
- Moving Averages (MA): The 5-day moving average has been consistently above the short-term (10-day) simple moving average, indicating a positive trend in the stock price.
- Exponential Moving Average (EMA): The EMA has been steadily increasing, reflecting bullish momentum in the stock.
- Moving Average Convergence Divergence (MACD): The MACD line has been above the signal line, suggesting a bullish trend in the stock price.
Key Observation: The trend indicators point towards a bullish sentiment in the stock price.
Momentum Indicators:
- Relative Strength Index (RSI): RSI values have been trending upwards, indicating increasing buying pressure in the stock.
- Stochastic Oscillator: Both %K and %D values have been consistently high, signaling strong upward momentum.
- Williams %R (Willams %R): The Williams %R is in the oversold territory, suggesting a potential reversal in the stock price.
Key Observation: Momentum indicators suggest a bullish momentum in the stock.
Volatility Indicators:
- Bollinger Bands (BB): The stock price has been trading within the upper Bollinger Band, indicating increased volatility but also potential overbought conditions.
- Bollinger Band Width (BBW): The BBW has been narrowing, suggesting a potential decrease in volatility.
Key Observation: Volatility indicators imply a mixed outlook with potential for a pullback due to overbought conditions.
Volume Indicators:
- On-Balance Volume (OBV): The OBV has been trending upwards, indicating accumulation of the stock by investors.
- Chaikin Money Flow (CMF): The CMF has been positive, reflecting buying pressure in the stock.
Key Observation: Volume indicators support the bullish sentiment in the stock.
Conclusion:
Based on the analysis of trend, momentum, volatility, and volume indicators, the overall outlook for FIDU suggests a bullish trend in the stock price. The positive momentum, increasing buying pressure, and accumulation of the stock by investors indicate a potential for further upside movement in the coming days. However, caution is advised due to the increased volatility and potential overbought conditions indicated by the Bollinger Bands. Traders should monitor the stock closely for any signs of a reversal or consolidation.
Recommendation:
Considering the bullish sentiment in the technical indicators, investors may consider buying opportunities in FIDU for potential short to medium-term gains. However, it is essential to set appropriate stop-loss levels to manage risks effectively. Monitoring the stock price closely and staying updated on market developments will be crucial for making informed trading decisions.