Technical Analysis of FIG 2024-05-10
Overview:
In analyzing the technical indicators for FIG over the last 5 days, we will delve into the trend, momentum, volatility, and volume indicators to provide a comprehensive outlook on the possible stock price movement in the coming days. By examining these key indicators, we aim to offer valuable insights and predictions to guide investment decisions.
Trend Analysis:
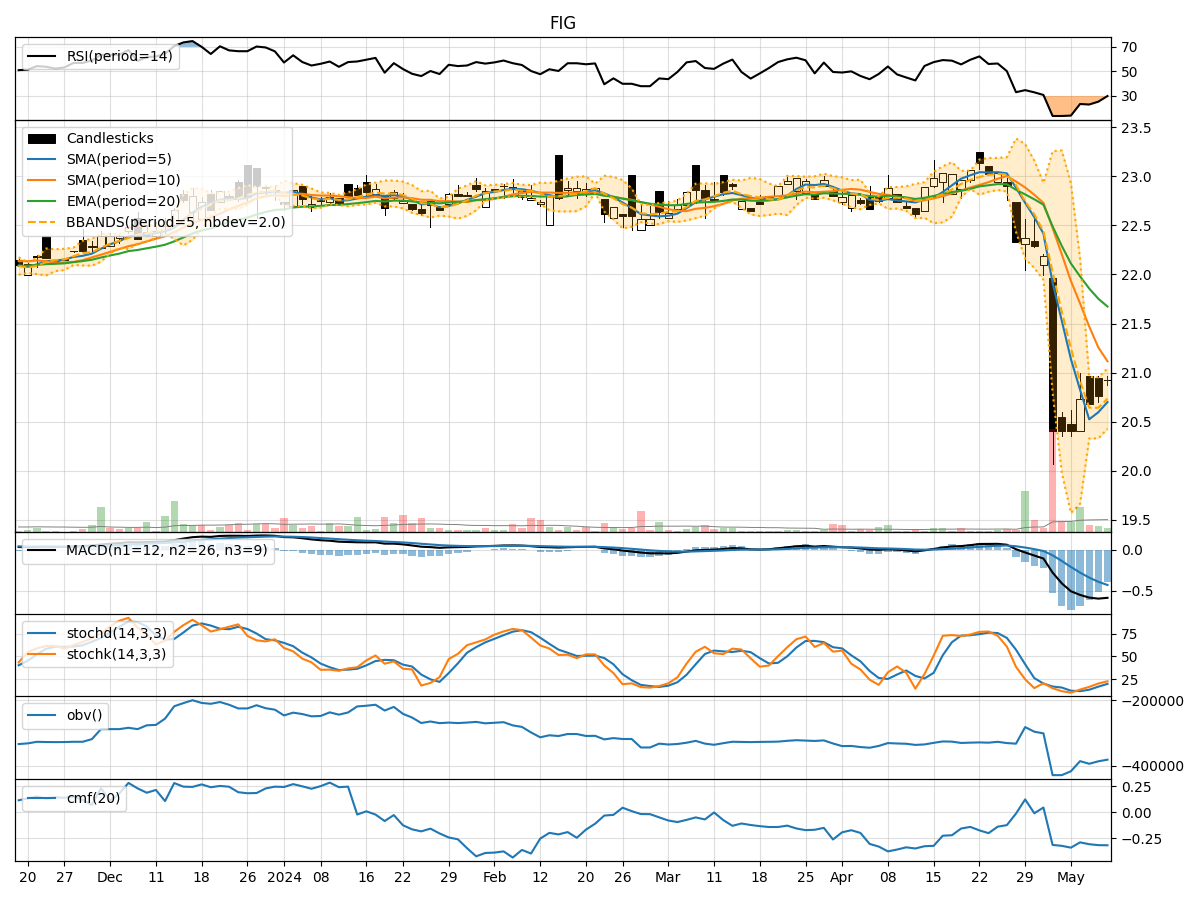
- Moving Averages (MA): The 5-day Moving Average (MA) has been consistently below the Simple Moving Average (SMA) and Exponential Moving Average (EMA) over the past 5 days, indicating a downward trend in the stock price.
- MACD: The Moving Average Convergence Divergence (MACD) has been negative, with the MACD line consistently below the Signal line, suggesting bearish momentum in the stock.
Momentum Analysis:
- RSI: The Relative Strength Index (RSI) has been gradually increasing but remains below the overbought threshold of 70, indicating a potential for further upward movement.
- Stochastic Oscillator: Both %K and %D lines of the Stochastic Oscillator have been rising, signaling increasing buying pressure and potential upward momentum.
- Williams %R: The Williams %R indicator has been moving towards the oversold region, suggesting a possible reversal to the upside.
Volatility Analysis:
- Bollinger Bands: The Bollinger Bands have been narrowing, indicating decreasing volatility in the stock price.
- Bollinger %B: The %B indicator has been gradually increasing, suggesting a potential breakout or uptrend in the stock price.
Volume Analysis:
- On-Balance Volume (OBV): The OBV has been negative, indicating more selling volume compared to buying volume over the past 5 days.
- Chaikin Money Flow (CMF): The CMF has been negative, reflecting a lack of buying pressure in the stock.
Conclusion:
Based on the analysis of the technical indicators, the stock of FIG is currently exhibiting a mixed outlook: - Trend: The trend indicators suggest a downward bias in the stock price. - Momentum: Momentum indicators show a potential for upward movement in the stock price. - Volatility: Volatility indicators point towards decreasing volatility in the stock. - Volume: Volume indicators indicate more selling pressure than buying pressure in the stock.
Overall Assessment:
Considering the mixed signals from the technical indicators, it is crucial to proceed with caution. While there is a possibility of a short-term uptrend based on momentum indicators, the overall trend and volume suggest a bearish sentiment. Traders should closely monitor key support and resistance levels for potential entry or exit points. The stock price of FIG may experience further downward movement in the near term.