Technical Analysis of FIGB 2024-05-10
Overview:
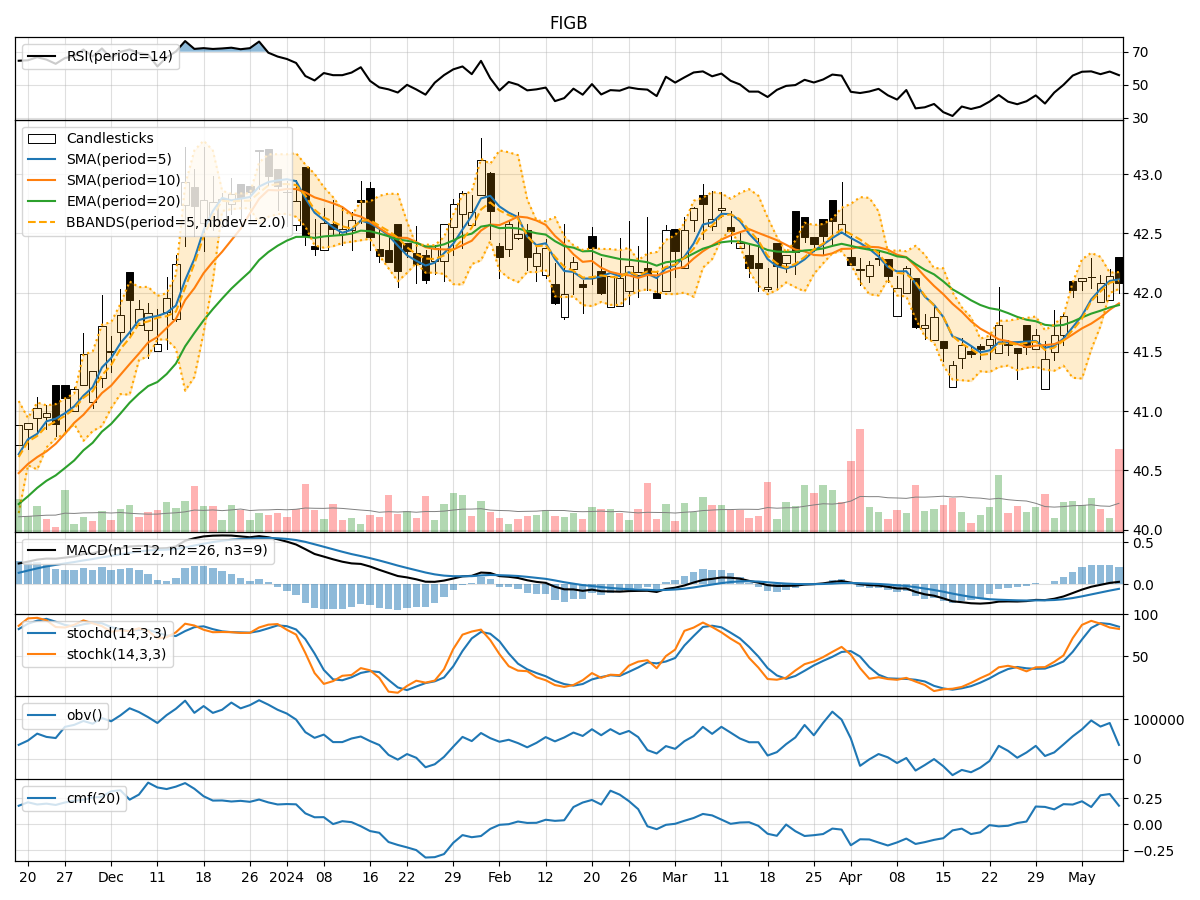
In analyzing the technical indicators for FIGB over the last 5 days, we will delve into the trend, momentum, volatility, and volume indicators to provide a comprehensive outlook on the possible stock price movement. By examining these key indicators, we aim to offer valuable insights and predictions for the upcoming days.
Trend Indicators:
- Moving Averages (MA): The 5-day MA has been consistently above the closing price, indicating a short-term uptrend.
- MACD: The MACD line has been positive, suggesting bullish momentum.
- RSI: The RSI has been fluctuating around the 50 level, indicating a neutral stance.
- Bollinger Bands: The price has been trading within the Bollinger Bands, showing a stable price range.
Momentum Indicators:
- Stochastic Oscillator: The Stochastic Oscillator has been in the overbought region, signaling potential selling pressure.
- Williams %R: The Williams %R has been hovering in the oversold territory, indicating a possible reversal.
- CMF: The Chaikin Money Flow has been positive, reflecting buying pressure.
Volatility Indicators:
- Bollinger Bands Width: The narrowing of the Bollinger Bands suggests decreasing volatility.
- Average True Range (ATR): The ATR has shown a decline, indicating reduced price fluctuations.
Volume Indicators:
- On-Balance Volume (OBV): The OBV has been mixed, reflecting indecision among market participants.
- Chaikin Money Flow (CMF): The CMF has been positive, indicating accumulation.
Key Observations:
- The trend indicators suggest a bullish bias in the short term.
- Momentum indicators show conflicting signals with overbought and oversold conditions.
- Volatility indicators point towards decreasing price volatility.
- Volume indicators indicate mixed sentiment among investors.
Conclusion:
Based on the analysis of the technical indicators, the next few days for FIGB are likely to see sideways consolidation with a slight upward bias. Traders should exercise caution due to the conflicting signals from momentum indicators and the mixed volume sentiment. It is advisable to closely monitor key support and resistance levels for potential entry and exit points.