Technical Analysis of FINE 2024-05-10
Overview:
In analyzing the technical indicators for the stock FINE over the last 5 days, we will delve into the trend, momentum, volatility, and volume indicators to provide a comprehensive outlook on the possible stock price movement in the coming days. By examining these key indicators, we aim to offer valuable insights and recommendations for potential investors.
Trend Indicators:
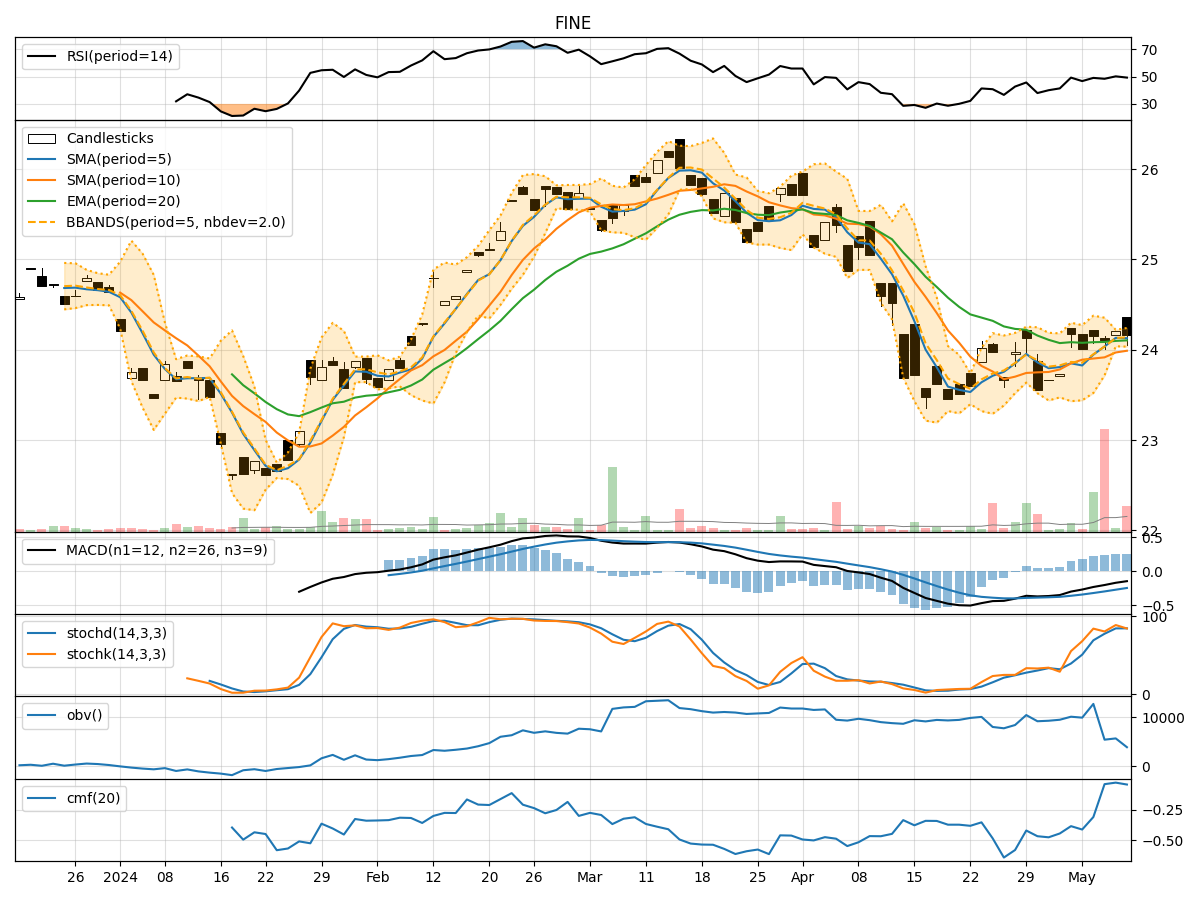
- Moving Averages (MA): The 5-day Moving Average (MA) has been consistently above the Simple Moving Average (SMA) and Exponential Moving Average (EMA), indicating a short-term bullish trend.
- MACD: The Moving Average Convergence Divergence (MACD) has been negative but showing signs of convergence towards the signal line, suggesting a potential reversal in the bearish momentum.
- MACD Histogram: The MACD Histogram has been gradually decreasing, indicating a slowdown in the bearish momentum.
Momentum Indicators:
- RSI: The Relative Strength Index (RSI) has been hovering around the neutral zone, indicating a balanced momentum without extreme overbought or oversold conditions.
- Stochastic Oscillator: Both %K and %D lines of the Stochastic Oscillator have been fluctuating in the overbought territory, suggesting a potential reversal or consolidation phase.
- Williams %R: The Williams %R is in the oversold region, indicating a possible buying opportunity in the short term.
Volatility Indicators:
- Bollinger Bands: The Bollinger Bands have been narrowing, indicating decreasing volatility and a potential breakout or significant price movement in the near future.
- Bollinger %B: The %B indicator has been fluctuating around the middle range, suggesting a period of consolidation or indecision among market participants.
Volume Indicators:
- On-Balance Volume (OBV): The OBV has been fluctuating, indicating mixed buying and selling pressure in the stock.
- Chaikin Money Flow (CMF): The CMF has been negative, reflecting a net outflow of money from the stock over the analyzed period.
Conclusion:
Based on the analysis of the technical indicators, the stock FINE is likely to experience sideways consolidation in the coming days. The convergence of the MACD lines, fluctuation in momentum indicators, narrowing Bollinger Bands, and mixed volume signals suggest a period of indecision and potential range-bound trading. Investors should exercise caution and wait for clearer signals before making significant trading decisions.