Technical Analysis of FINX 2024-05-10
Overview:
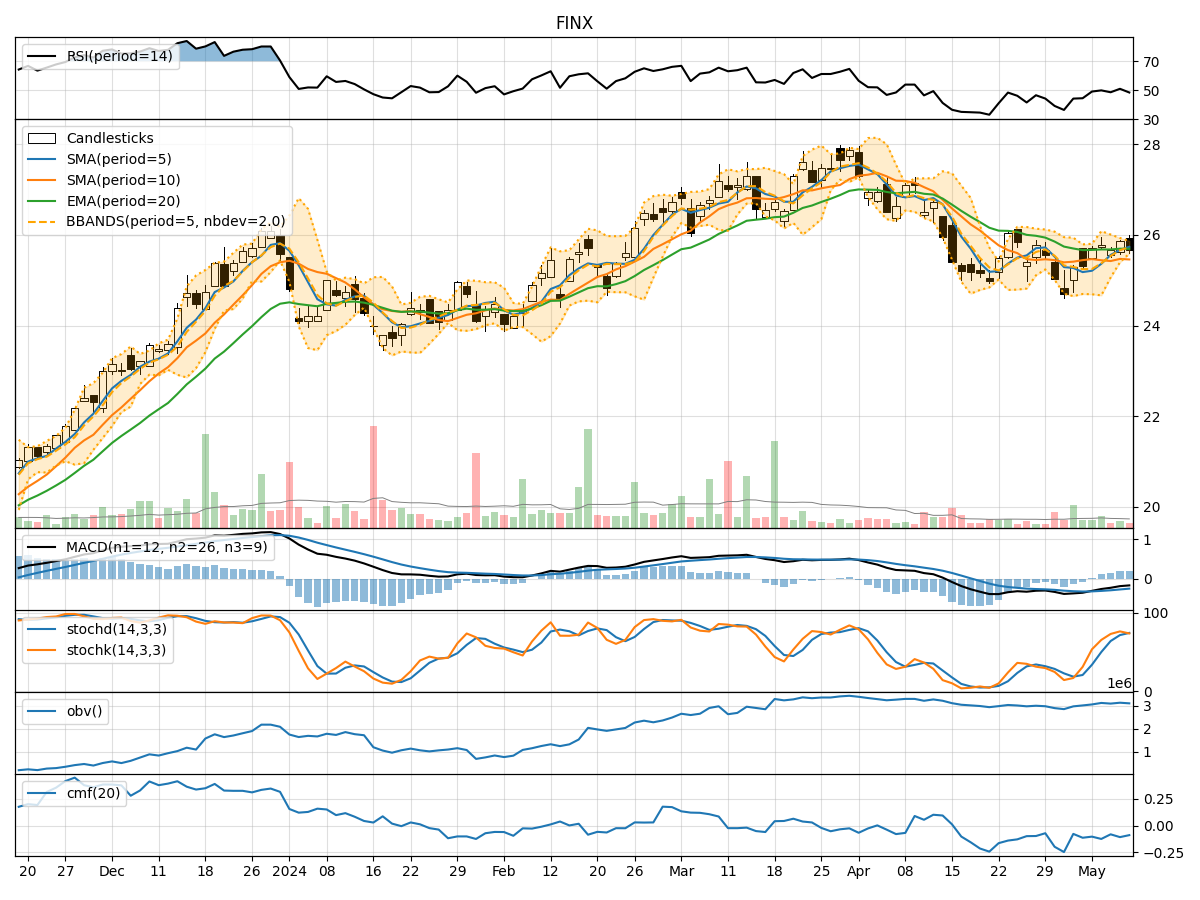
In analyzing the technical indicators for FINX over the last 5 days, we will delve into the trend, momentum, volatility, and volume indicators to provide a comprehensive outlook on the possible stock price movement in the coming days. By examining these key indicators, we aim to offer valuable insights and predictions for potential investors and traders.
Trend Analysis:
- Moving Averages (MA): The 5-day Moving Average (MA) has been fluctuating around the closing prices, indicating short-term price trends. The Simple Moving Average (SMA) and Exponential Moving Average (EMA) have been relatively close, suggesting stability in the trend.
- MACD: The Moving Average Convergence Divergence (MACD) has shown a negative trend, with the MACD line consistently below the signal line. This indicates a bearish momentum in the stock price.
- Conclusion: The trend indicators suggest a bearish outlook for the stock in the short term.
Momentum Analysis:
- RSI: The Relative Strength Index (RSI) has been hovering around the neutral zone, indicating a lack of strong momentum in either direction.
- Stochastic Oscillator: Both %K and %D have been fluctuating, but %D has been consistently higher, suggesting a potential reversal in momentum.
- Conclusion: The momentum indicators show a neutral stance, with a slight inclination towards a potential bullish reversal.
Volatility Analysis:
- Bollinger Bands (BB): The Bollinger Bands have shown narrowing volatility, with the stock price moving closer to the lower band. This could indicate a period of consolidation or a potential breakout.
- Conclusion: The volatility indicators point towards a consolidation phase, with the possibility of a breakout in either direction.
Volume Analysis:
- On-Balance Volume (OBV): The OBV has been relatively stable, indicating a balance between buying and selling pressure.
- Chaikin Money Flow (CMF): The CMF has been negative, suggesting a slight outflow of money from the stock.
- Conclusion: The volume indicators reflect a neutral sentiment, with no clear direction in terms of buying or selling pressure.
Overall Conclusion:
Based on the analysis of the trend, momentum, volatility, and volume indicators, the next few days for FINX could see a sideways movement with a slight bullish bias. The bearish trend indicated by the MACD may be countered by the potential bullish reversal hinted by the stochastic oscillator. The consolidation in volatility also supports the view of a sideways movement. However, investors should closely monitor the price action for any breakout or trend reversal signals.
Key Takeaways:
- Trend: Bearish
- Momentum: Neutral with a slight bullish bias
- Volatility: Consolidation
- Volume: Neutral
- Overall Outlook: Sideways with a slight bullish bias
Investors are advised to exercise caution and consider risk management strategies in light of the mixed signals from the technical indicators. Monitoring key support and resistance levels can help in making informed trading decisions.