Technical Analysis of FISR 2024-05-10
Overview:
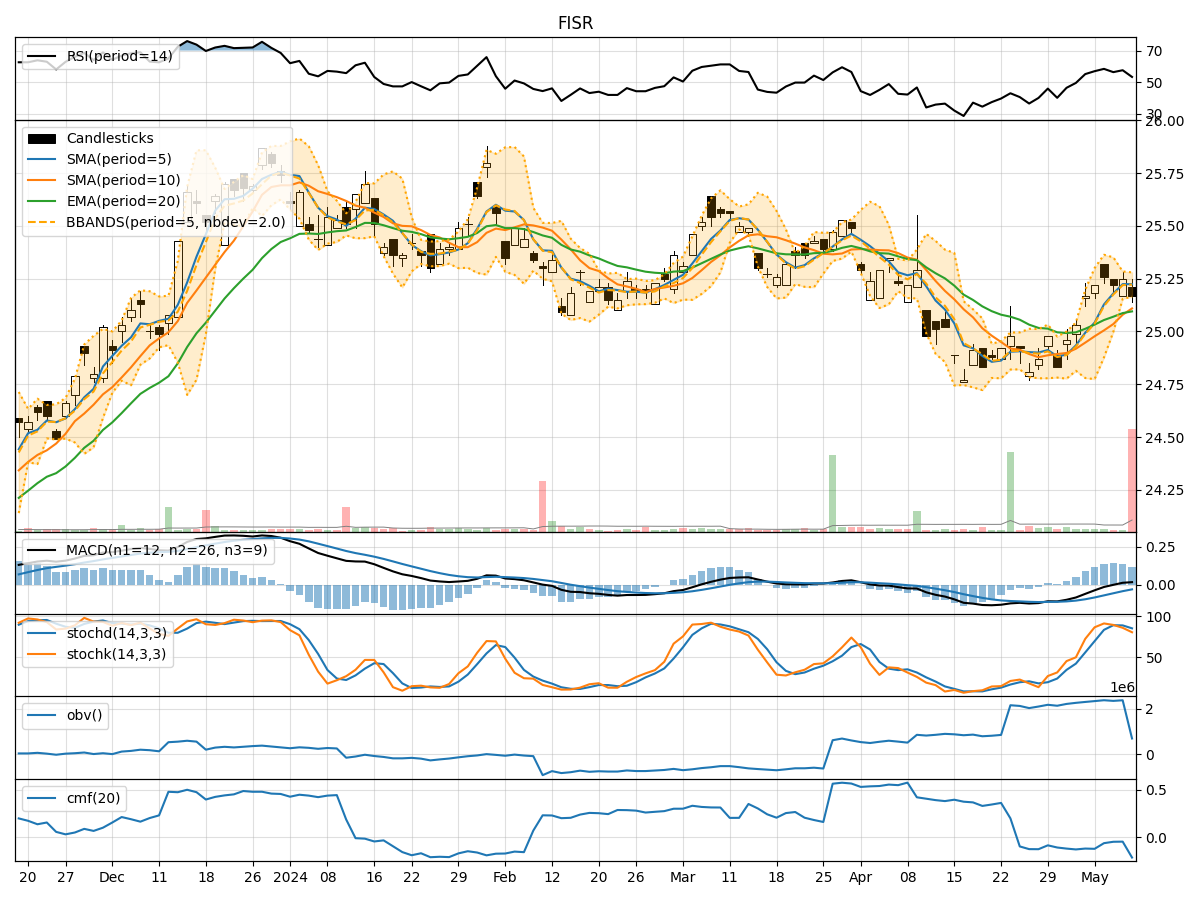
In analyzing the technical indicators for FISR over the last 5 days, we will delve into the trend, momentum, volatility, and volume indicators to provide a comprehensive outlook on the possible stock price movement in the coming days.
Trend Analysis:
- Moving Averages (MA): The 5-day Moving Average has been consistently above the Simple Moving Average (SMA) and Exponential Moving Average (EMA), indicating a short-term bullish trend.
- MACD: The MACD line has been consistently above the signal line, with both lines showing an upward trend, suggesting bullish momentum.
- MACD Histogram: The MACD Histogram has been positive and increasing, indicating strengthening bullish momentum.
Momentum Analysis:
- RSI: The Relative Strength Index (RSI) has been fluctuating around the 50 level, indicating a neutral momentum.
- Stochastic Oscillator: Both %K and %D lines of the Stochastic Oscillator have been in the overbought zone, suggesting a potential reversal or consolidation.
- Williams %R: The Williams %R has been in the oversold territory, indicating a potential buying opportunity.
Volatility Analysis:
- Bollinger Bands: The stock price has been trading within the Bollinger Bands, with the bands narrowing, suggesting decreasing volatility.
- Bollinger %B: The %B indicator has been hovering around the middle line, indicating a balanced market sentiment.
Volume Analysis:
- On-Balance Volume (OBV): The OBV has been relatively stable, indicating a balance between buying and selling pressure.
- Chaikin Money Flow (CMF): The CMF has been negative, suggesting a slight distribution phase.
Key Observations:
- The trend indicators suggest a bullish bias in the short term.
- Momentum indicators show mixed signals, with potential for a reversal or consolidation.
- Volatility has been decreasing, indicating a possible period of consolidation.
- Volume indicators point towards a balanced market sentiment with a slight distribution phase.
Conclusion:
Based on the analysis of the technical indicators, the next few days for FISR stock price movement could see sideways consolidation with a slight bullish bias. Traders may consider monitoring key support and resistance levels for potential entry or exit points. It is advisable to exercise caution and wait for clearer signals from the momentum indicators before making significant trading decisions.