Technical Analysis of FITE 2024-05-10
Overview:
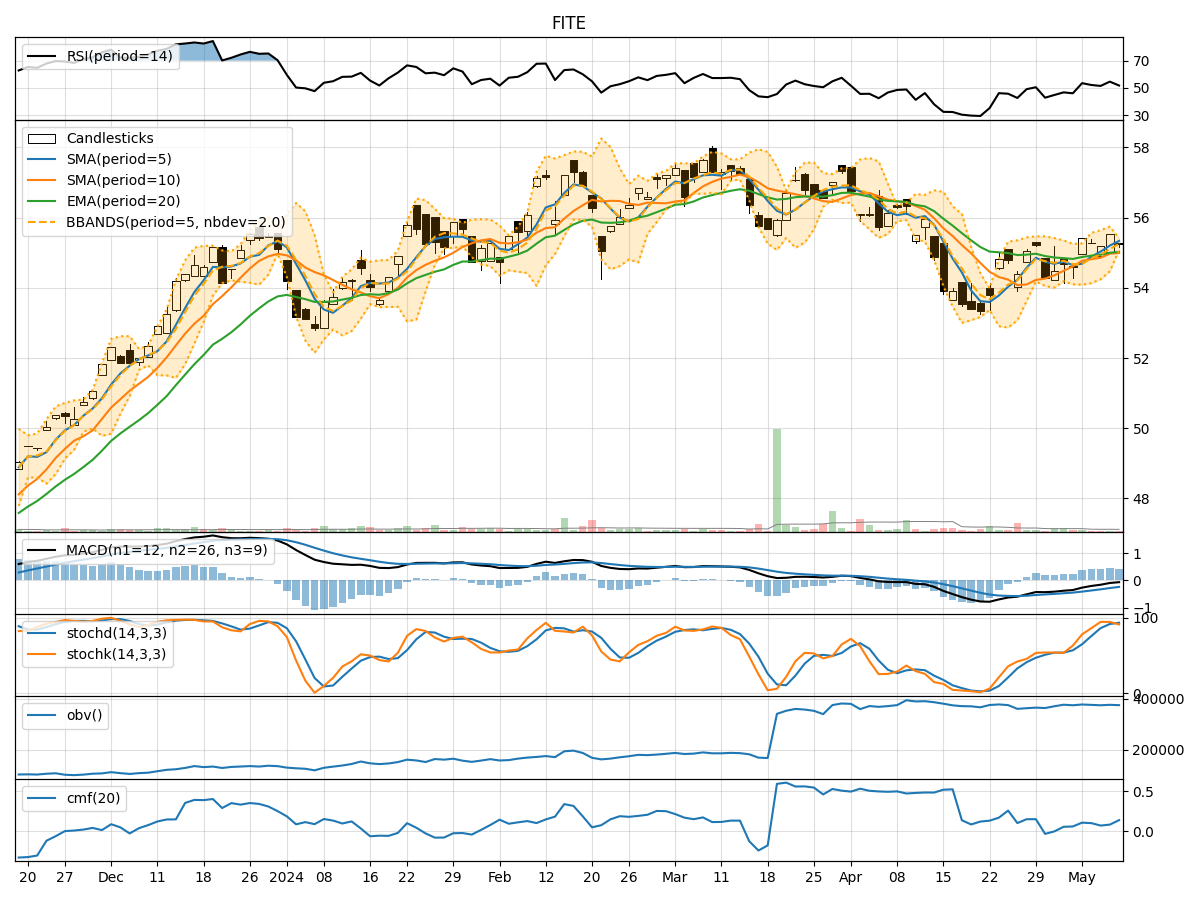
In analyzing the technical indicators for FITE over the last 5 days, we will delve into the trend, momentum, volatility, and volume indicators to provide a comprehensive outlook on the possible stock price movement in the coming days. By examining these key indicators, we aim to offer valuable insights and predictions for potential investors and traders.
Trend Analysis:
- Moving Averages (MA): The 5-day Moving Average (MA) has been consistently above the Simple Moving Average (SMA) and Exponential Moving Average (EMA), indicating a bullish trend.
- MACD: The MACD line has been below the signal line but showing signs of convergence, suggesting a potential bullish crossover in the near future.
Momentum Analysis:
- RSI: The Relative Strength Index (RSI) has been fluctuating around the overbought territory, indicating strong buying momentum.
- Stochastic Oscillator: Both %K and %D have been in the overbought zone, suggesting a potential reversal or consolidation.
Volatility Analysis:
- Bollinger Bands (BB): The stock price has been trading within the Bollinger Bands, with the bands narrowing, indicating decreasing volatility.
- Bollinger Band Percentage (BBP): The BBP has been decreasing, suggesting a potential breakout or significant price movement.
Volume Analysis:
- On-Balance Volume (OBV): The OBV has been relatively stable, indicating consistent buying pressure.
- Chaikin Money Flow (CMF): The CMF has been positive, reflecting strong accumulation in the stock.
Key Observations:
- The trend indicators suggest a bullish bias, supported by the moving averages and potential MACD crossover.
- Momentum indicators show a strong buying momentum but hint at a possible reversal due to overbought conditions.
- Volatility indicators point towards decreasing volatility, potentially leading to a breakout.
- Volume indicators indicate consistent buying pressure and accumulation in the stock.
Conclusion:
Based on the analysis of the technical indicators, the stock price of FITE is likely to experience further upward movement in the coming days. The bullish trend supported by moving averages and potential MACD crossover, along with consistent buying pressure and accumulation, indicates a positive outlook for the stock. However, traders should be cautious of the overbought conditions highlighted by the momentum indicators, which could lead to a short-term consolidation or pullback before resuming the upward trend. Overall, the bullish view is favored for the next few days, with potential opportunities for long positions in FITE.