Technical Analysis of FIVG 2024-05-10
Overview:
In analyzing the technical indicators for FIVG over the last 5 days, we will delve into the trend, momentum, volatility, and volume indicators to provide a comprehensive outlook on the possible stock price movement in the coming days. By examining these key indicators, we aim to offer valuable insights and predictions for potential investors.
Trend Analysis:
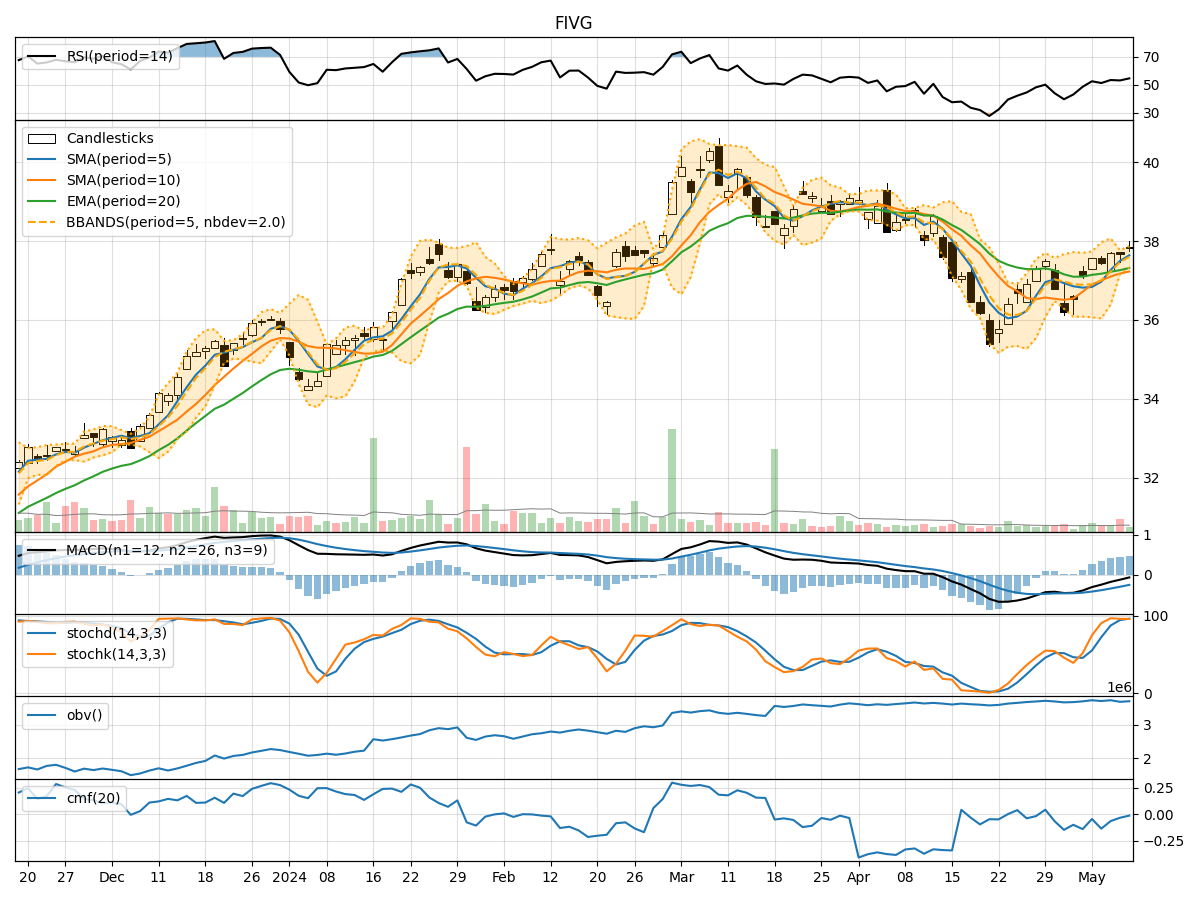
- Moving Averages (MA): The 5-day Moving Average (MA) has been consistently above the Simple Moving Average (SMA) and Exponential Moving Average (EMA), indicating a bullish trend.
- MACD: The MACD line has been negative but trending upwards, while the MACD Histogram has been consistently increasing, suggesting a potential bullish reversal.
Momentum Analysis:
- RSI: The Relative Strength Index (RSI) has been fluctuating around the neutral zone, indicating indecision in the market.
- Stochastic Oscillator: Both %K and %D have been in overbought territory, signaling a potential reversal or consolidation.
- Williams %R: The Williams %R has been in oversold territory, suggesting a possible buying opportunity.
Volatility Analysis:
- Bollinger Bands (BB): The stock price has been trading within the Bollinger Bands, with the bands narrowing, indicating decreasing volatility.
- Bollinger %B: The %B indicator has been fluctuating around the midline, reflecting a lack of clear direction in price movement.
Volume Analysis:
- On-Balance Volume (OBV): The OBV has been declining, indicating selling pressure in the market.
- Chaikin Money Flow (CMF): The CMF has been negative, suggesting outflow of money from the stock.
Key Observations:
- The trend indicators suggest a potential bullish reversal, supported by the increasing MACD Histogram.
- Momentum indicators show mixed signals, with RSI indicating neutrality and Stochastic Oscillator hinting at a possible reversal.
- Volatility has been decreasing, indicating a period of consolidation or sideways movement.
- Volume indicators point towards selling pressure and a negative money flow.
Conclusion:
Based on the analysis of the technical indicators, the stock price of FIVG is likely to experience sideways movement or consolidation in the coming days. The bullish signals from the trend indicators may be offset by the mixed momentum signals and the negative volume indicators. Investors should exercise caution and closely monitor the price action for any potential shifts in market sentiment.