Technical Analysis of FJP 2024-05-10
Overview:
In analyzing the technical indicators for FJP stock over the last 5 days, we will delve into the trend, momentum, volatility, and volume indicators to provide a comprehensive outlook on the possible future stock price movement. By examining these key indicators, we aim to offer valuable insights and predictions for the upcoming trading days.
Trend Analysis:
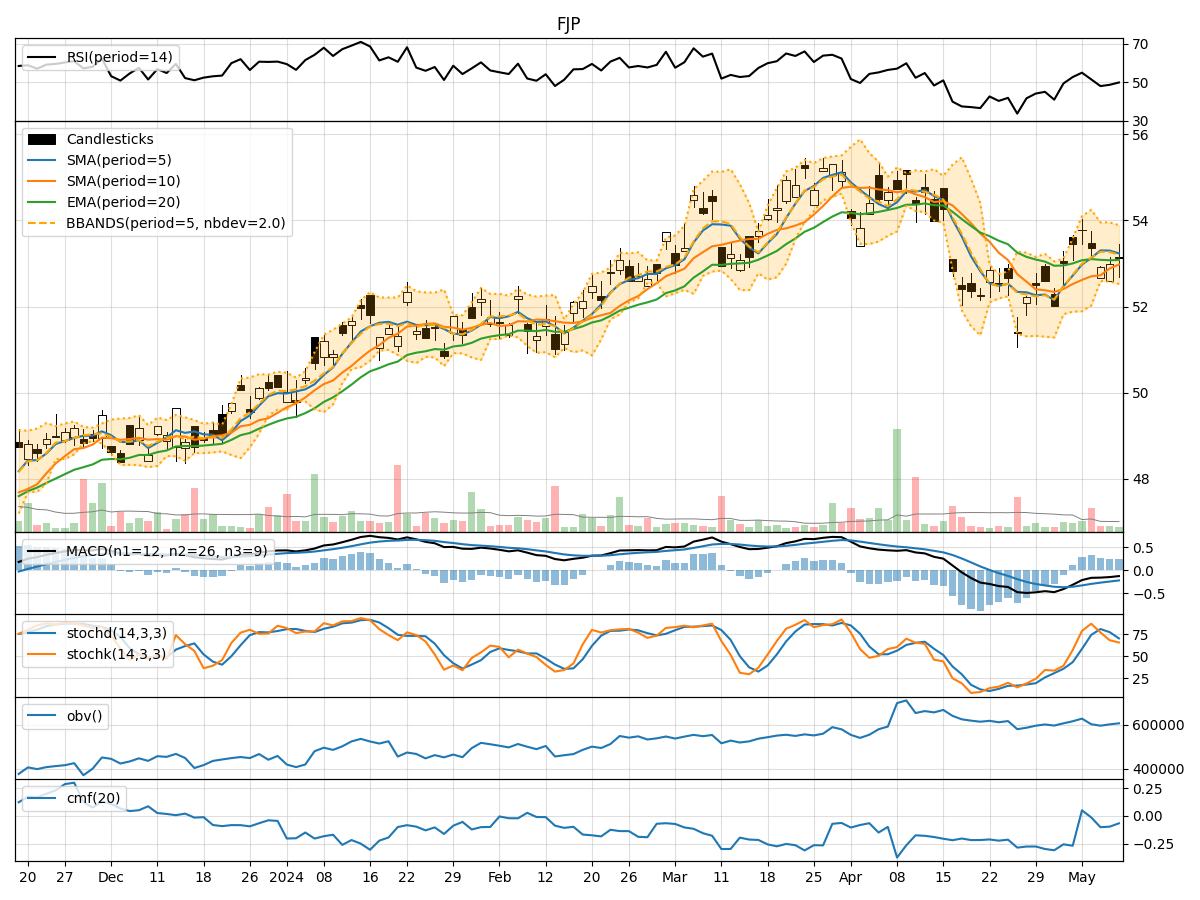
- Moving Averages (MA): The 5-day Moving Average (MA) has been relatively stable around the $53 level, indicating a moderate trend.
- MACD: The Moving Average Convergence Divergence (MACD) has shown a slight negative trend, with the MACD line consistently below the signal line.
- EMA: The Exponential Moving Average (EMA) has been fluctuating around $53, suggesting a neutral trend.
Key Observation: The trend indicators suggest a neutral to slightly bearish outlook for FJP stock in the short term.
Momentum Analysis:
- RSI: The Relative Strength Index (RSI) has been fluctuating around the mid-level, indicating a lack of strong momentum.
- Stochastic Oscillator: Both %K and %D of the Stochastic Oscillator have been declining, signaling weakening momentum.
- Williams %R: The Williams %R has been hovering in the oversold territory, suggesting a potential reversal.
Key Observation: Momentum indicators point towards a neutral to slightly bearish momentum for FJP stock.
Volatility Analysis:
- Bollinger Bands (BB): The Bollinger Bands have shown narrowing volatility, with the stock price trading within the bands.
- Bollinger %B: The %B indicator has been relatively stable around the mid-level, indicating balanced volatility.
Key Observation: Volatility indicators suggest a period of consolidation and stability in the stock price.
Volume Analysis:
- On-Balance Volume (OBV): The OBV has shown mixed signals with fluctuations in volume, indicating indecision among market participants.
- Chaikin Money Flow (CMF): The CMF has been negative, reflecting selling pressure in the stock.
Key Observation: Volume indicators imply a lack of strong conviction among investors, leading to uncertainty in the stock price direction.
Conclusion:
Based on the analysis of trend, momentum, volatility, and volume indicators, the overall outlook for FJP stock in the next few days leans towards a sideways consolidation pattern with a slightly bearish bias. The stock is likely to trade within a narrow range with limited upside potential, as indicated by the neutral to bearish signals across various technical indicators.
Key Conclusion: The next few days may see FJP stock experiencing sideways movement with a potential downside bias, suggesting caution for investors looking to enter or exit positions.
By considering these technical indicators collectively, investors can make more informed decisions regarding FJP stock, taking into account the current market dynamics and potential price movements.