Technical Analysis of FJUN 2024-05-10
Overview:
In analyzing the technical indicators for FJUN stock over the last 5 days, we will delve into the trend, momentum, volatility, and volume indicators to provide a comprehensive outlook on the possible stock price movement in the coming days. By examining these key indicators, we aim to offer valuable insights and predictions for potential investors.
Trend Indicators:
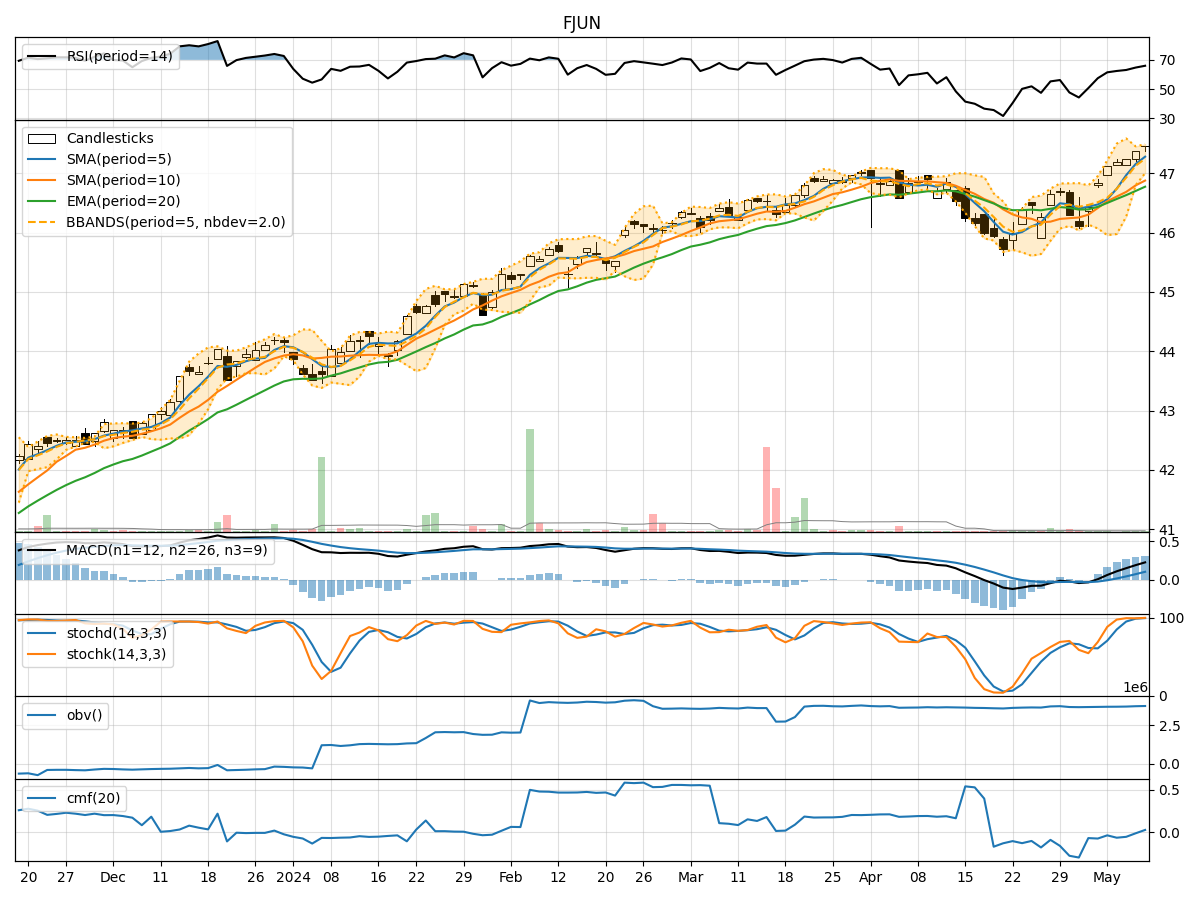
- Moving Averages (MA): The 5-day MA has been consistently above the closing prices, indicating an upward trend. Both the SMA(10) and EMA(20) have also shown an increasing trend, supporting the bullish sentiment.
- MACD: The MACD line has been above the signal line for the past 5 days, with both lines trending upwards. The MACD histogram has been positive, suggesting bullish momentum.
Momentum Indicators:
- RSI: The RSI has been steadily increasing and is currently in the overbought territory, indicating strong buying momentum.
- Stochastic Oscillator: Both %K and %D lines are near or at 100, signaling an overbought condition. This could potentially lead to a short-term pullback.
- Williams %R: The indicator is also in the overbought zone, suggesting a possible reversal in the short term.
Volatility Indicators:
- Bollinger Bands: The stock price has been trading near the upper Bollinger Band, indicating high volatility. The bands are relatively wide, suggesting potential price swings.
- Bollinger %B: The %B is above 0.8, indicating that the stock is trading at the upper band, which could signal a overbought condition.
Volume Indicators:
- On-Balance Volume (OBV): The OBV has been declining over the past 5 days, indicating distribution rather than accumulation.
- Chaikin Money Flow (CMF): The CMF has been negative, suggesting selling pressure in the stock.
Conclusion:
Based on the analysis of the technical indicators, the stock is currently exhibiting overbought conditions in both momentum and volatility indicators. The trend indicators suggest a bullish trend, but the overbought signals from momentum and volatility indicators could lead to a short-term correction or consolidation in the stock price.
Recommendation:
Considering the overbought signals and the potential for a short-term pullback, investors should exercise caution. It might be prudent to wait for a retracement or consolidation before considering entry points. Short-term traders could look for opportunities to capitalize on potential price swings, while long-term investors may consider waiting for a more favorable entry point.
Key Takeaways:
- Short-term Outlook: Bearish due to overbought conditions.
- Long-term Outlook: Bullish based on the overall trend.
- Risk Management: Set stop-loss orders to protect gains and manage risk effectively.
By carefully monitoring the indicators and market dynamics, investors can make informed decisions aligned with their risk tolerance and investment goals.