Technical Analysis of FKU 2024-05-10
Overview:
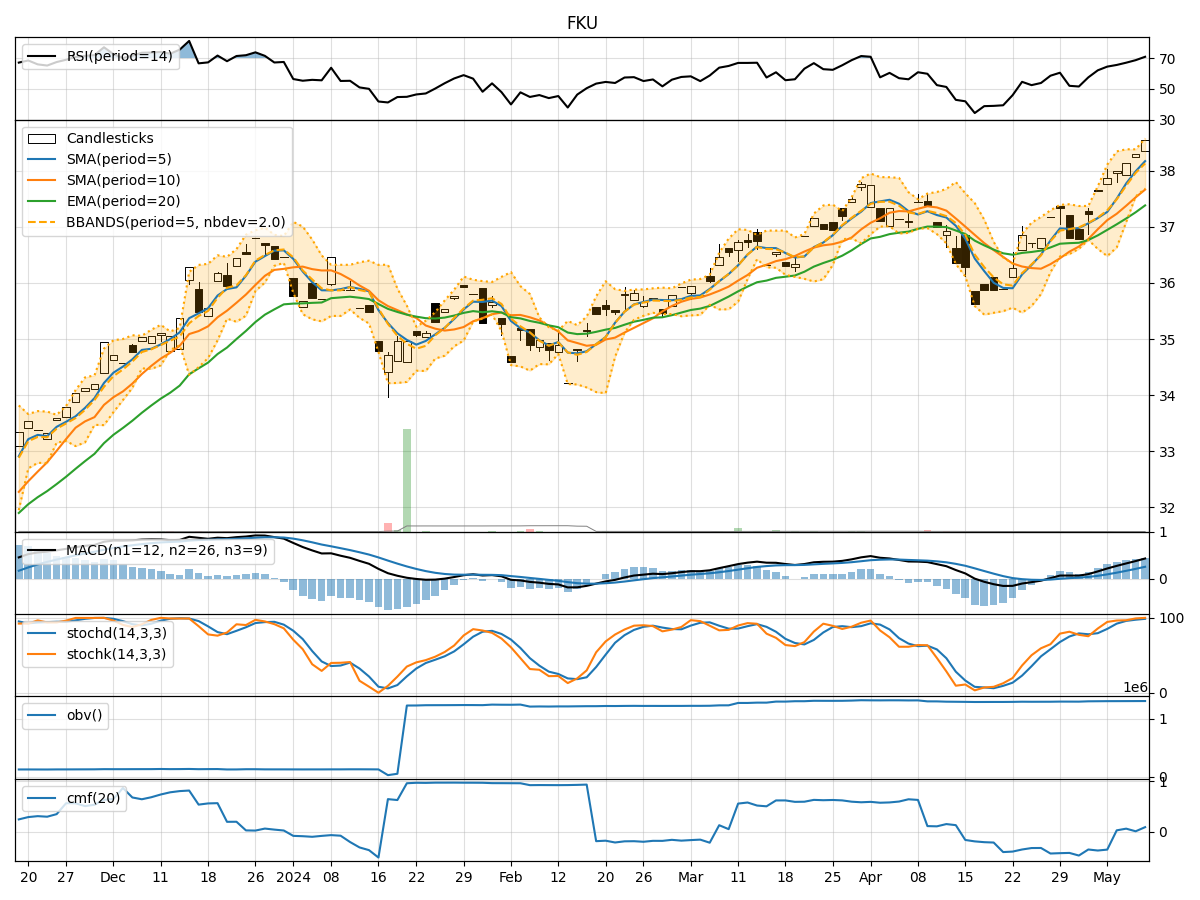
In analyzing the technical indicators for FKU stock over the last 5 days, we will delve into the trends, momentum, volatility, and volume aspects to provide a comprehensive outlook on the possible stock price movement in the coming days. By examining key indicators such as moving averages, MACD, RSI, Stochastic Oscillator, Bollinger Bands, and On-Balance Volume, we aim to offer valuable insights and predictions for FKU stock.
Trend Analysis:
- Moving Averages (MA): The 5-day MA has been consistently rising, indicating a bullish trend in the short term.
- MACD: The MACD line has been above the signal line, suggesting positive momentum.
Momentum Analysis:
- RSI: The RSI has been trending upwards, showing increasing buying pressure.
- Stochastic Oscillator: Both %K and %D have been in overbought territory, signaling a strong bullish momentum.
Volatility Analysis:
- Bollinger Bands: The stock price has been consistently trading above the middle Bollinger Band, indicating an uptrend with low volatility.
Volume Analysis:
- On-Balance Volume (OBV): The OBV has been steadily increasing, reflecting accumulation by investors.
Key Observations:
- The stock is in a strong bullish trend based on moving averages and MACD.
- Momentum indicators like RSI and Stochastic Oscillator suggest a continuation of the bullish momentum.
- Volatility remains low, indicating a stable uptrend.
- Increasing OBV signifies growing buying interest in the stock.
Conclusion:
Based on the analysis of technical indicators, the FKU stock is likely to continue its upward trajectory in the coming days. The strong bullish trend, supported by positive momentum and increasing buying pressure, indicates a favorable outlook for the stock price. Investors may consider buying or holding positions in FKU stock for potential further gains.