Technical Analysis of FLAX 2024-05-10
Overview:
In analyzing the technical indicators for FLAX stock over the last 5 days, we will delve into the trends, momentum, volatility, and volume indicators to provide a comprehensive outlook on the possible future stock price movements. By examining these key aspects, we aim to offer valuable insights and recommendations for potential investors.
Trend Indicators:
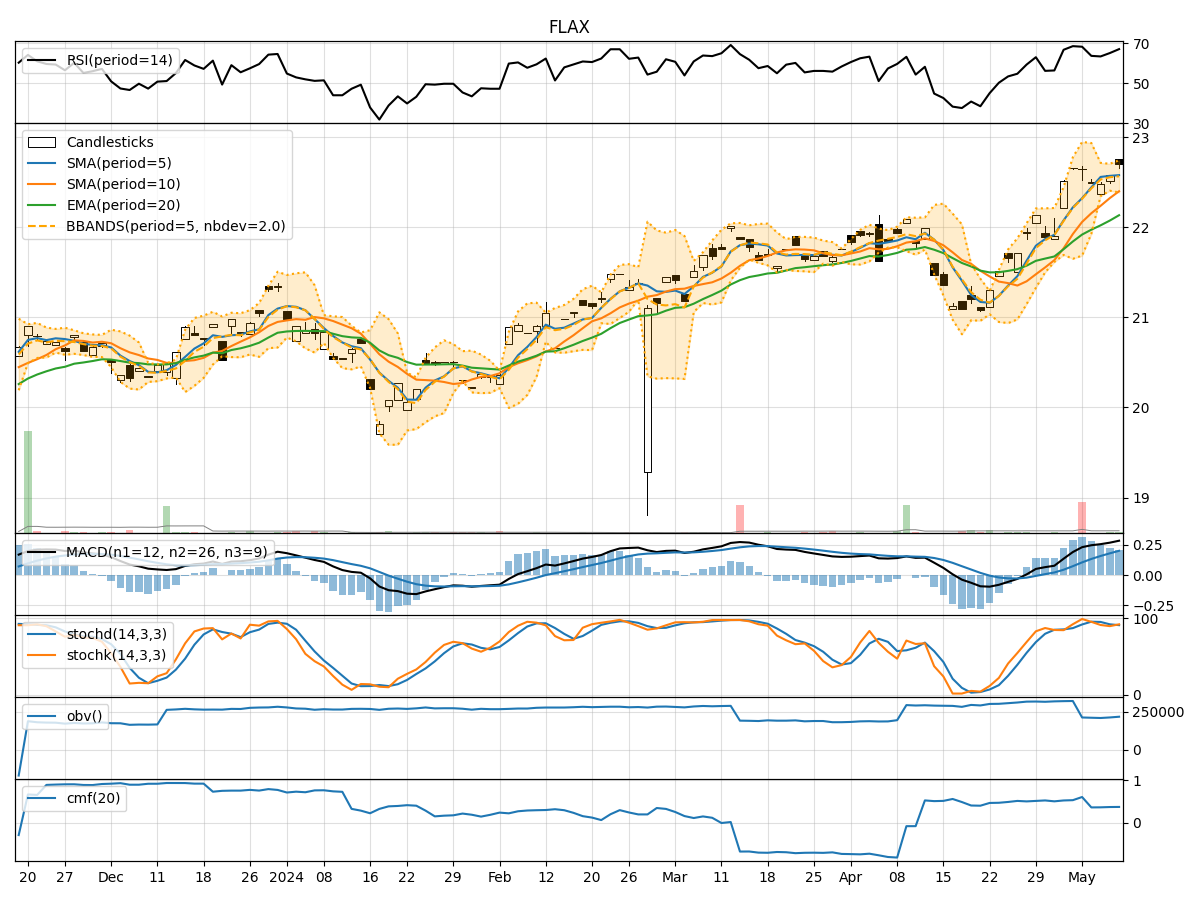
- Moving Averages (MA): The 5-day Moving Average (MA) has been consistently above the Simple Moving Average (SMA) and Exponential Moving Average (EMA), indicating a bullish trend.
- MACD: The MACD line has been consistently above the signal line, with both lines showing an upward trend, suggesting bullish momentum.
- MACD Histogram: The MACD Histogram has been increasing over the past 5 days, indicating strengthening bullish momentum.
Momentum Indicators:
- RSI: The Relative Strength Index (RSI) has been in the overbought territory but has shown a slight decline, indicating a potential reversal or consolidation.
- Stochastic Oscillator: Both %K and %D lines of the Stochastic Oscillator have been fluctuating in the overbought region, suggesting a possible reversal or consolidation.
- Williams %R: The Williams %R has been hovering in the oversold region, indicating a potential buying opportunity.
Volatility Indicators:
- Bollinger Bands: The Bollinger Bands have been narrowing, indicating decreasing volatility and a potential price breakout in the near future.
- Bollinger %B: The %B indicator has been fluctuating around the midline, suggesting a period of consolidation or indecision in the market.
Volume Indicators:
- On-Balance Volume (OBV): The OBV has shown a slight decrease over the last 5 days, indicating some selling pressure.
- Chaikin Money Flow (CMF): The CMF has been positive but relatively stable, suggesting a neutral sentiment towards the stock.
Key Observations and Opinions:
- Trend: The trend indicators suggest a strong bullish sentiment in the short term.
- Momentum: The momentum indicators show signs of potential reversal or consolidation due to overbought conditions.
- Volatility: Volatility indicators point towards a potential breakout as the Bollinger Bands narrow.
- Volume: The volume indicators indicate a slight decrease in buying pressure but overall neutral sentiment.
Conclusion:
Based on the analysis of the technical indicators, the next few days for FLAX stock are likely to see further upward movement in price, supported by the bullish trend and momentum. However, caution is advised as the momentum indicators signal a potential reversal or consolidation in the near term. Traders should closely monitor key levels and wait for confirmation of a sustained uptrend before making significant investment decisions.