Technical Analysis of FLBL 2024-05-10
Overview:
In analyzing the technical indicators for FLBL over the last 5 days, we will delve into the trend, momentum, volatility, and volume indicators to provide a comprehensive assessment of the stock's potential price movement. By examining these key factors, we aim to offer valuable insights and predictions for the next few days.
Trend Analysis:
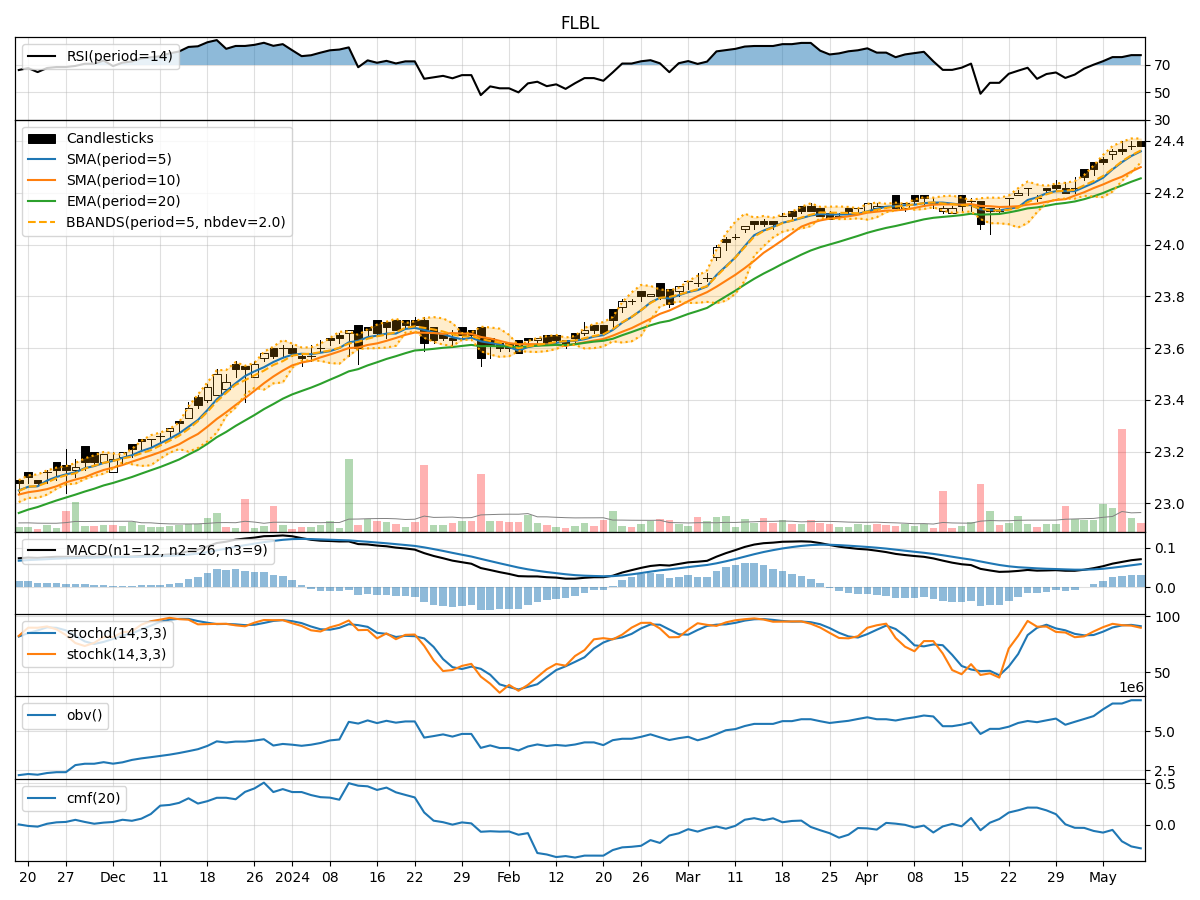
- Moving Averages (MA): The 5-day Moving Average (MA) has been steadily increasing, indicating a positive trend in the stock price.
- MACD: The MACD line has been consistently above the signal line, suggesting bullish momentum in the stock.
Momentum Analysis:
- RSI: The Relative Strength Index (RSI) has been in the overbought territory, indicating a potential reversal or consolidation phase.
- Stochastic Oscillator: Both %K and %D have been relatively high, signaling a strong bullish momentum.
Volatility Analysis:
- Bollinger Bands (BB): The stock price has been trading within the upper Bollinger Band, indicating an overbought condition.
Volume Analysis:
- On-Balance Volume (OBV): The OBV has been increasing, suggesting accumulation by investors.
- Chaikin Money Flow (CMF): The CMF has been negative, indicating selling pressure in the stock.
Key Observations:
- The stock is currently in an overbought condition based on the RSI and Bollinger Bands.
- The MACD shows strong bullish momentum, while the Stochastic Oscillator indicates potential overbought levels.
- The OBV suggests accumulation, but the CMF reflects selling pressure.
Conclusion:
Based on the technical indicators and analysis: - Trend: The stock is in an upward trend based on moving averages and MACD. - Momentum: The stock shows strong bullish momentum but may be reaching overbought levels. - Volatility: The stock is currently overbought according to Bollinger Bands. - Volume: While there is accumulation indicated by OBV, the CMF suggests selling pressure.
Future Price Movement Prediction:
Considering the overbought conditions, potential reversal signals from the RSI, and the selling pressure indicated by the CMF, it is likely that the stock may experience a short-term correction or consolidation in the next few days. Traders should be cautious of a possible pullback in the stock price.
Recommendation:
- Short-term Traders: Consider taking profits or setting tight stop-loss orders to protect gains.
- Long-term Investors: Monitor the price action closely for a potential entry point during a correction or consolidation phase.
Disclaimer:
Remember that technical analysis is not foolproof and should be used in conjunction with other forms of analysis. Market conditions can change rapidly, so it's essential to stay informed and adapt your strategies accordingly.