Technical Analysis of FLBR 2024-05-10
Overview:
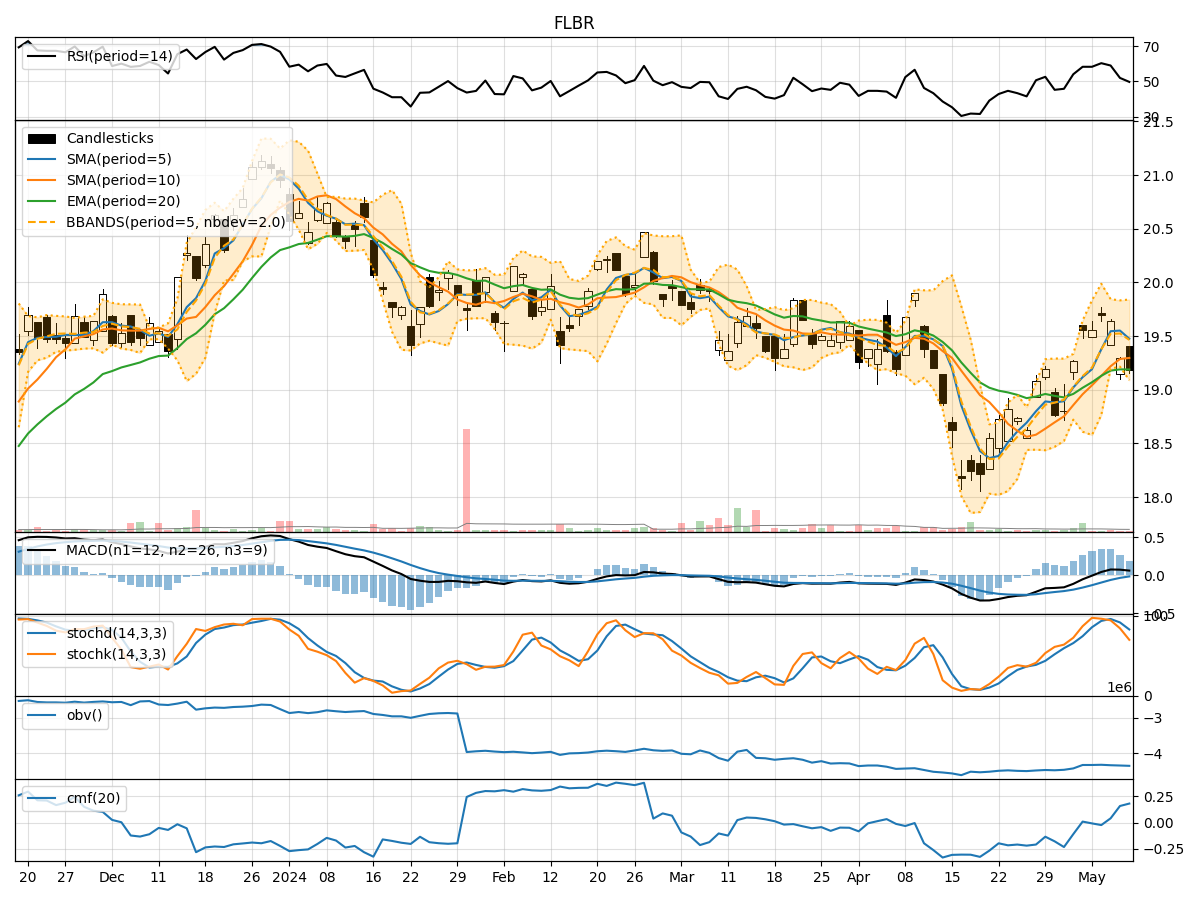
In analyzing the technical indicators for FLBR over the last 5 days, we will delve into the trend, momentum, volatility, and volume indicators to provide a comprehensive outlook on the possible stock price movement. By examining these key factors, we aim to offer valuable insights and predictions for the upcoming days.
Trend Analysis:
- Moving Averages (MA): The 5-day Moving Average (MA) has been fluctuating around the closing prices, indicating a relatively stable trend.
- MACD: The Moving Average Convergence Divergence (MACD) has shown positive values, suggesting a bullish momentum in the short term.
- EMA: The Exponential Moving Average (EMA) has been slightly increasing, reflecting a positive trend.
Momentum Analysis:
- RSI: The Relative Strength Index (RSI) has been hovering around 50, indicating a neutral momentum.
- Stochastic Oscillator: Both %K and %D values have been declining, signaling a potential bearish momentum.
- Williams %R: The Williams %R is in the oversold territory, suggesting a possible reversal in momentum.
Volatility Analysis:
- Bollinger Bands: The Bollinger Bands have been narrowing, indicating decreasing volatility in the stock price.
- Bollinger %B: The %B value has been relatively low, suggesting a potential consolidation phase.
Volume Analysis:
- On-Balance Volume (OBV): The OBV has been decreasing, indicating selling pressure in the stock.
- Chaikin Money Flow (CMF): The CMF has shown positive values, reflecting buying interest in the stock.
Key Observations:
- The trend indicators suggest a positive outlook with the MACD showing bullish signals.
- Momentum indicators are mixed, with RSI neutral, Stochastic Oscillator bearish, and Williams %R in oversold territory.
- Volatility is decreasing, indicating a possible consolidation phase.
- Volume indicators show selling pressure but with some buying interest based on CMF.
Conclusion:
Based on the analysis of technical indicators, the stock price of FLBR is likely to experience sideways movement in the next few days. The bullish trend indicated by the MACD may be offset by the bearish momentum from the Stochastic Oscillator and oversold conditions of Williams %R. The decreasing volatility and mixed volume signals further support the expectation of a consolidation phase. Traders should exercise caution and closely monitor key levels for potential breakout or reversal opportunities.