Technical Analysis of FLCB 2024-05-10
Overview:
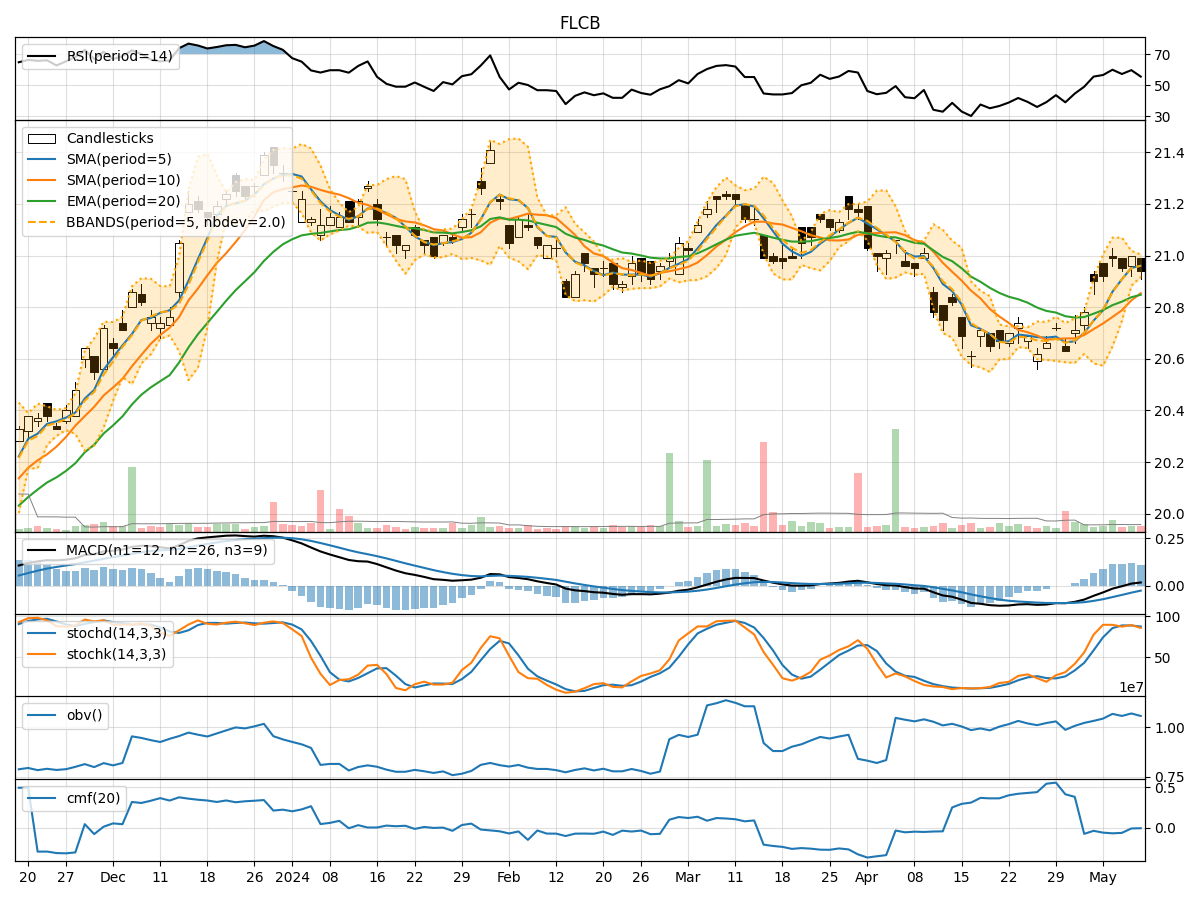
In analyzing the technical indicators for FLCB over the last 5 days, we will delve into the trend, momentum, volatility, and volume indicators to provide a comprehensive outlook on the possible stock price movement in the coming days. By examining key metrics such as moving averages, MACD, RSI, Bollinger Bands, and OBV, we aim to offer valuable insights and predictions for potential price action.
Trend Indicators:
- Moving Averages (MA): The 5-day MA has been trending slightly above the simple moving average (SMA) and exponential moving average (EMA) over the past 5 days, indicating a short-term uptrend.
- MACD: The MACD line has been consistently positive, suggesting bullish momentum in the stock.
- MACD Histogram: The MACD histogram has been increasing, indicating strengthening bullish momentum.
Momentum Indicators:
- RSI: The RSI has been fluctuating around the 50 level, indicating a neutral stance in terms of momentum.
- Stochastic Oscillator: Both %K and %D have been hovering around the overbought territory, suggesting a potential reversal or consolidation.
- Williams %R: The Williams %R has been in the oversold region, signaling a possible buying opportunity.
Volatility Indicators:
- Bollinger Bands: The stock price has been trading within the Bollinger Bands, with the bands narrowing, indicating decreasing volatility.
- Bollinger %B: The %B indicator has been fluctuating around the middle band, suggesting a balanced market sentiment.
Volume Indicators:
- On-Balance Volume (OBV): The OBV has been relatively stable, indicating a neutral volume flow.
- Chaikin Money Flow (CMF): The CMF has been negative, suggesting a slight outflow of money from the stock.
Key Observations and Opinions:
- Trend: The stock is currently in an upward trend based on the moving averages and MACD analysis.
- Momentum: Momentum indicators are mixed, with the RSI neutral, stochastic oscillator potentially signaling a reversal, and Williams %R indicating a buying opportunity.
- Volatility: Volatility has been decreasing, as seen in the narrowing Bollinger Bands, which could lead to a period of consolidation.
- Volume: Volume indicators suggest a neutral volume flow, with a slight outflow of money based on the CMF.
Conclusion:
Based on the analysis of the technical indicators, the next few days for FLCB could see sideways movement or consolidation as the stock price may trade within a tight range. Traders should monitor key levels such as support and resistance to identify potential breakout or breakdown points. It is essential to wait for confirmation from multiple indicators before making any trading decisions.