Technical Analysis of FLCH 2024-05-10
Overview:
In analyzing the technical indicators for FLCH over the last 5 days, we will delve into the trend, momentum, volatility, and volume indicators to provide a comprehensive outlook on the possible stock price movement in the coming days. By examining these key aspects, we aim to offer valuable insights and predictions for potential investors.
Trend Analysis:
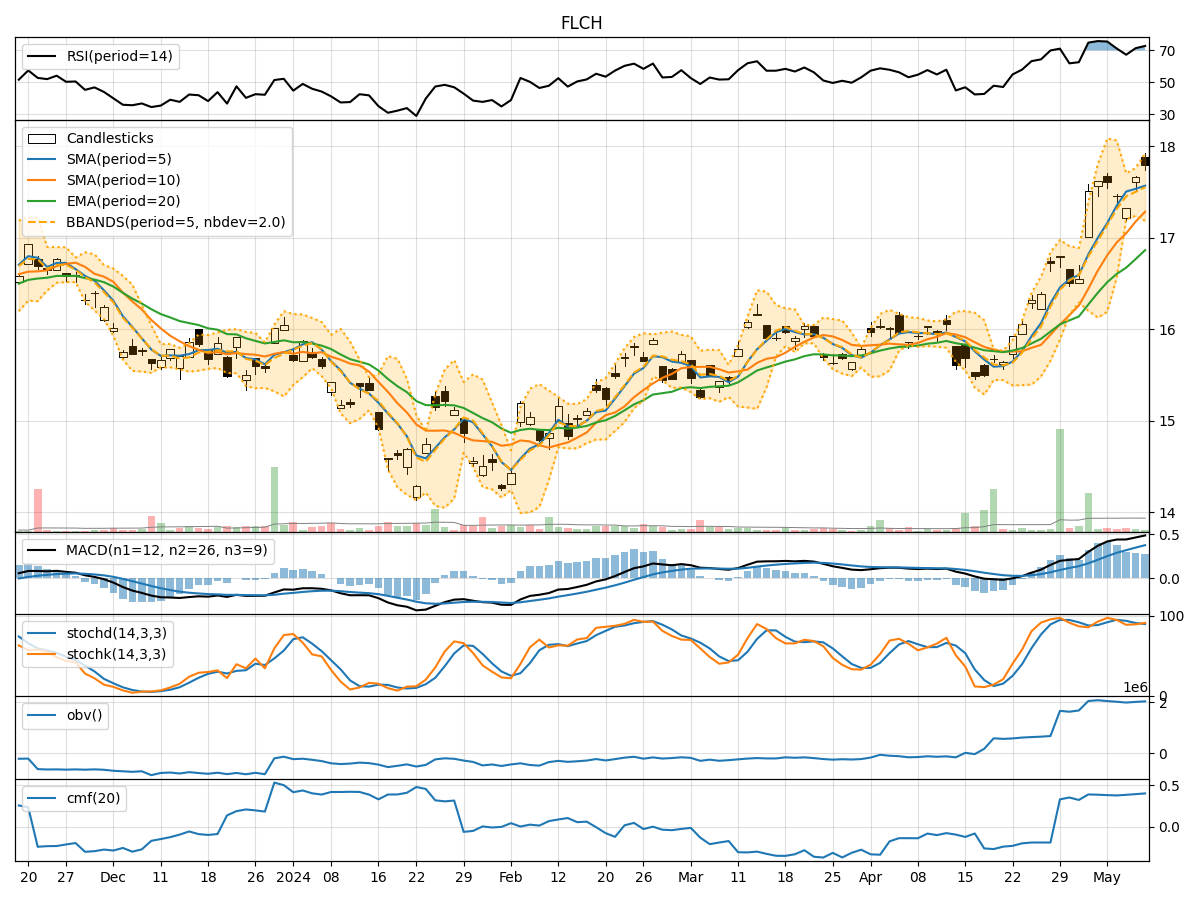
- Moving Averages (MA): The 5-day Moving Average (MA) has been consistently above the Simple Moving Average (SMA) and Exponential Moving Average (EMA), indicating a bullish trend.
- MACD: The MACD line has been above the signal line, with both lines showing an upward trend, suggesting bullish momentum.
- Conclusion: The trend indicators point towards an upward movement in the stock price.
Momentum Analysis:
- RSI: The Relative Strength Index (RSI) has been above 70 for most of the days, indicating overbought conditions but also strong momentum.
- Stochastic Oscillator: Both %K and %D have been above 80, signaling potential overbought conditions.
- Conclusion: Momentum indicators suggest a strong bullish sentiment in the market.
Volatility Analysis:
- Bollinger Bands (BB): The stock price has mostly remained within the upper Bollinger Band (BBU), indicating high volatility.
- Conclusion: Volatility indicators suggest a highly volatile market environment.
Volume Analysis:
- On-Balance Volume (OBV): The OBV has shown a slight increase over the last 5 days, indicating accumulation of the stock.
- Chaikin Money Flow (CMF): The CMF has been positive, suggesting buying pressure in the market.
- Conclusion: Volume indicators point towards positive accumulation and buying interest.
Conclusion:
Based on the analysis of trend, momentum, volatility, and volume indicators, the overall outlook for FLCH in the next few days is bullish. The stock is likely to experience an upward movement driven by strong bullish momentum, positive accumulation, and high volatility. Investors may consider taking advantage of this potential uptrend by considering long positions or holding onto existing positions.
Key Takeaways:
- Trend: Upward trend supported by moving averages and MACD.
- Momentum: Strong bullish momentum indicated by RSI and Stochastic Oscillator.
- Volatility: High volatility levels observed through Bollinger Bands.
- Volume: Positive accumulation and buying pressure shown by OBV and CMF.
Recommendation:
Considering the overall bullish outlook and positive market sentiment, investors may look for opportunities to enter long positions or hold onto existing positions in FLCH. However, it is essential to monitor the market closely and set appropriate risk management strategies to navigate the high volatility environment effectively.