Technical Analysis of FLCO 2024-05-10
Overview:
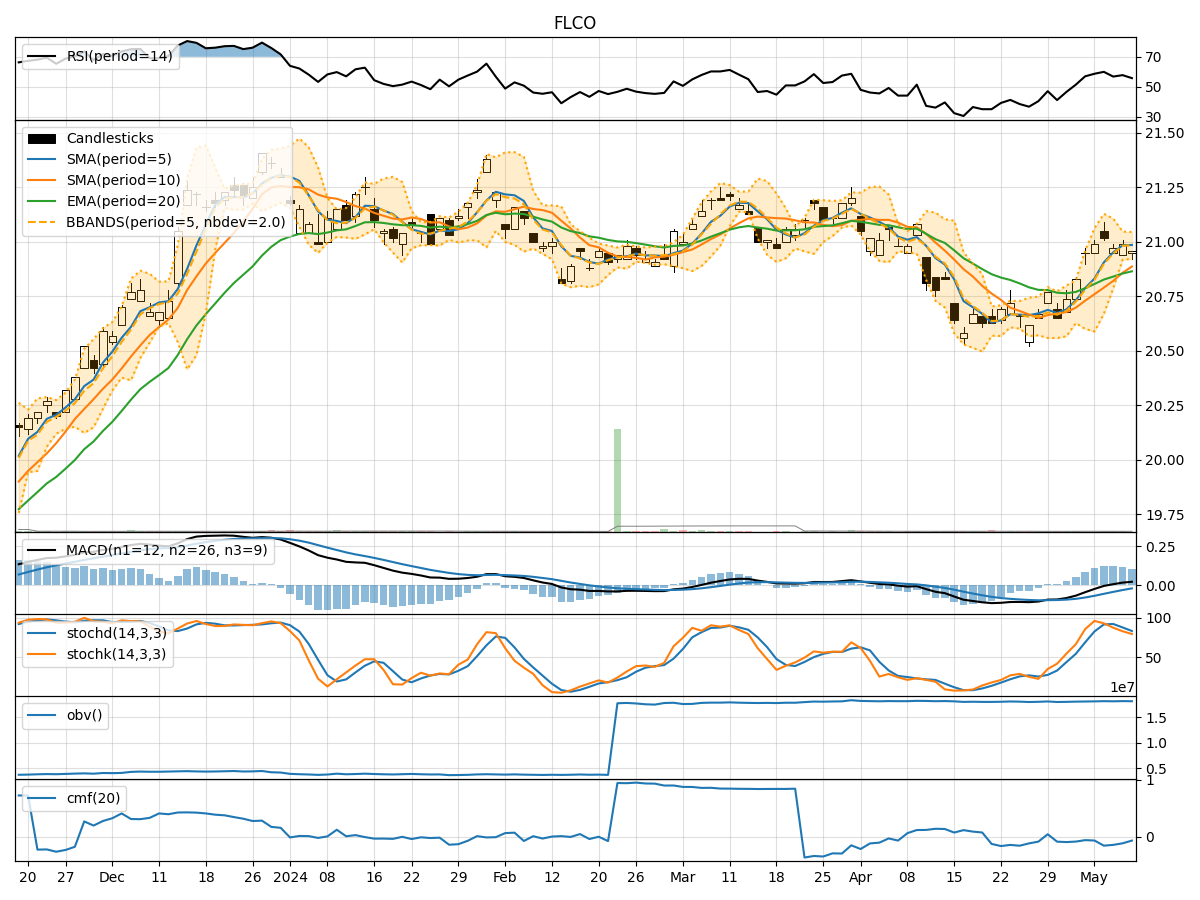
In the last 5 trading days, FLCO stock has shown mixed signals across various technical indicators. The trend indicators suggest a slightly bullish sentiment, with moving averages trending upwards. Momentum indicators indicate a neutral to slightly bearish momentum, while volatility indicators show a decreasing volatility trend. Volume indicators also suggest a neutral sentiment with no clear accumulation or distribution pattern.
Trend Indicators:
- Moving Averages (MA): The 5-day MA is above the 10-day SMA and 20-day EMA, indicating a short-term bullish trend.
- MACD: The MACD line is above the signal line, suggesting a bullish momentum.
- MACD Histogram: The histogram is positive, indicating increasing bullish momentum.
Momentum Indicators:
- RSI: The RSI is in the neutral zone around 50, indicating a lack of strong buying or selling pressure.
- Stochastic Oscillator: Both %K and %D are in the oversold region, suggesting a potential reversal.
- Williams %R: The indicator is in the oversold territory, indicating a possible buying opportunity.
Volatility Indicators:
- Bollinger Bands (BB): The bands are narrowing, indicating decreasing volatility.
- BB %B: The %B is below 0.2, suggesting a potential oversold condition.
Volume Indicators:
- On-Balance Volume (OBV): The OBV is relatively flat, indicating a lack of significant accumulation or distribution.
- Chaikin Money Flow (CMF): The CMF is negative, suggesting a slight outflow of money from the stock.
Key Observations:
- The trend indicators show a bullish bias, supported by moving averages and MACD.
- Momentum indicators suggest a neutral to slightly bearish sentiment, with potential for a reversal indicated by stochastic and Williams %R.
- Volatility is decreasing, indicating a possible period of consolidation or a calm before a potential move.
- Volume indicators do not show a clear trend, indicating a lack of strong buying or selling pressure.
Conclusion:
Based on the analysis of the technical indicators, the next few days for FLCO stock could see sideways movement or consolidation. The bullish trend indicated by moving averages and MACD may be offset by the neutral to slightly bearish momentum signals. The decreasing volatility suggests a period of stability, while volume indicators do not provide a clear direction. Traders should exercise caution and wait for clearer signals before making significant trading decisions.