Technical Analysis of FLDB 2024-05-10
Overview:
In analyzing the technical indicators for FLDB over the last 5 days, we will delve into the trend, momentum, volatility, and volume indicators to provide a comprehensive outlook on the possible stock price movement in the coming days. By examining these key indicators, we aim to offer valuable insights and recommendations for potential investors.
Trend Indicators:
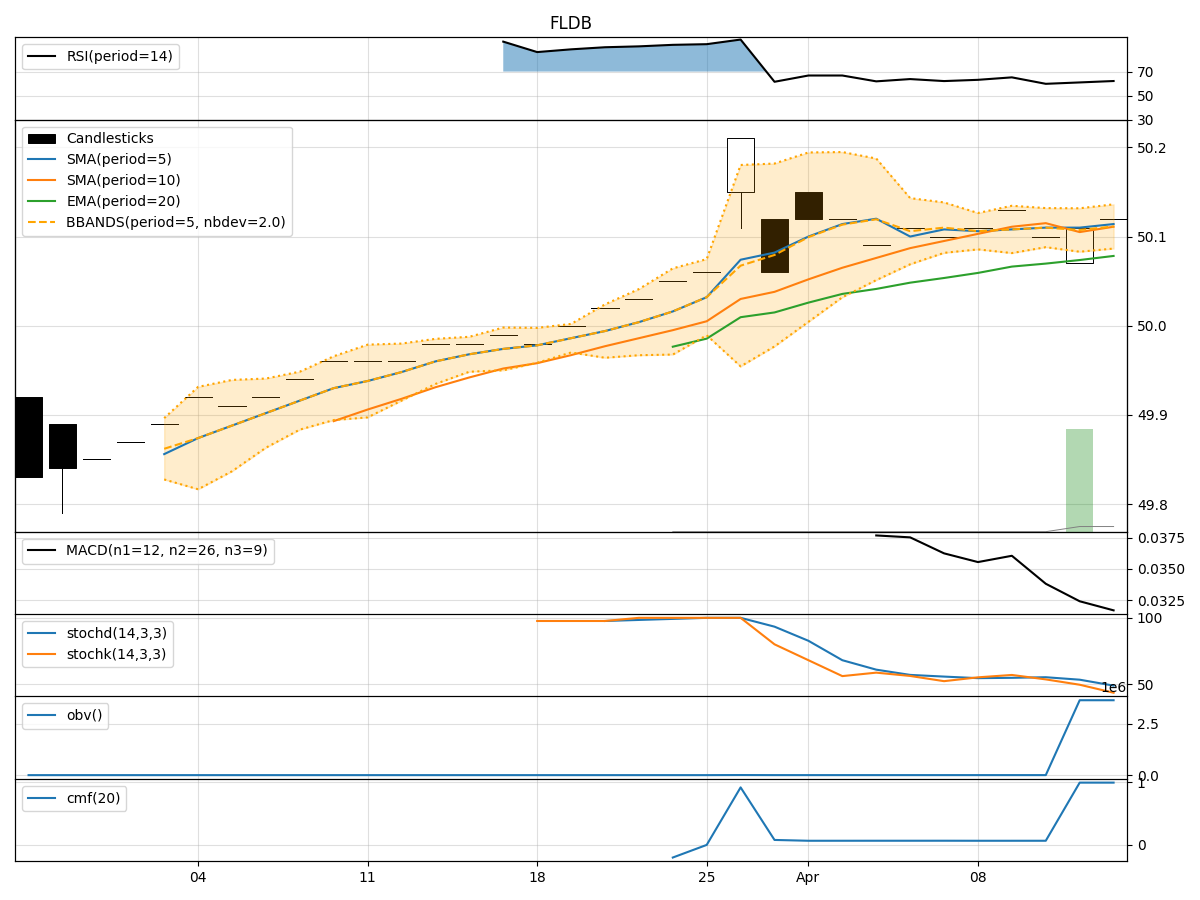
- Moving Averages (MA): The 5-day MA has been consistently above the closing price, indicating a short-term uptrend.
- MACD: The MACD line has been positive, suggesting bullish momentum.
- RSI: The RSI has been in the overbought territory, indicating a strong bullish sentiment.
Key Observation: The trend indicators suggest a bullish outlook for FLDB.
Momentum Indicators:
- Stochastic Oscillator: The Stochastic Oscillator has been fluctuating but remains in the overbought zone.
- Williams %R (WillR): The WillR indicator has been consistently in the oversold territory.
Key Observation: Momentum indicators show mixed signals with a slight bias towards overbought conditions.
Volatility Indicators:
- Bollinger Bands (BB): The price has been trading within the upper Bollinger Band, indicating increased volatility.
- Average True Range (ATR): ATR has shown relatively stable volatility levels over the past few days.
Key Observation: Volatility indicators suggest heightened price fluctuations but within a manageable range.
Volume Indicators:
- On-Balance Volume (OBV): The OBV has shown slight fluctuations but has not diverged significantly from price movements.
- Chaikin Money Flow (CMF): CMF has been relatively stable, indicating consistent buying pressure.
Key Observation: Volume indicators reflect a neutral stance with no significant divergence from price action.
Conclusion:
Based on the analysis of trend, momentum, volatility, and volume indicators, the overall outlook for FLDB appears to be bullish in the short term. The trend indicators signal a positive momentum, supported by the overbought RSI. While momentum indicators show some mixed signals, the overall bias remains towards bullish sentiment. Volatility indicators suggest manageable price fluctuations within the upper Bollinger Band, indicating potential for further upside movement.
Recommendation:
Considering the bullish trend and momentum, investors may consider buying FLDB in the short term. However, it is essential to monitor the momentum indicators closely for any signs of potential reversal. Additionally, keeping an eye on key support and resistance levels can help in managing risk and maximizing returns in line with the current market dynamics.