Technical Analysis of FLDZ 2024-05-10
Overview:
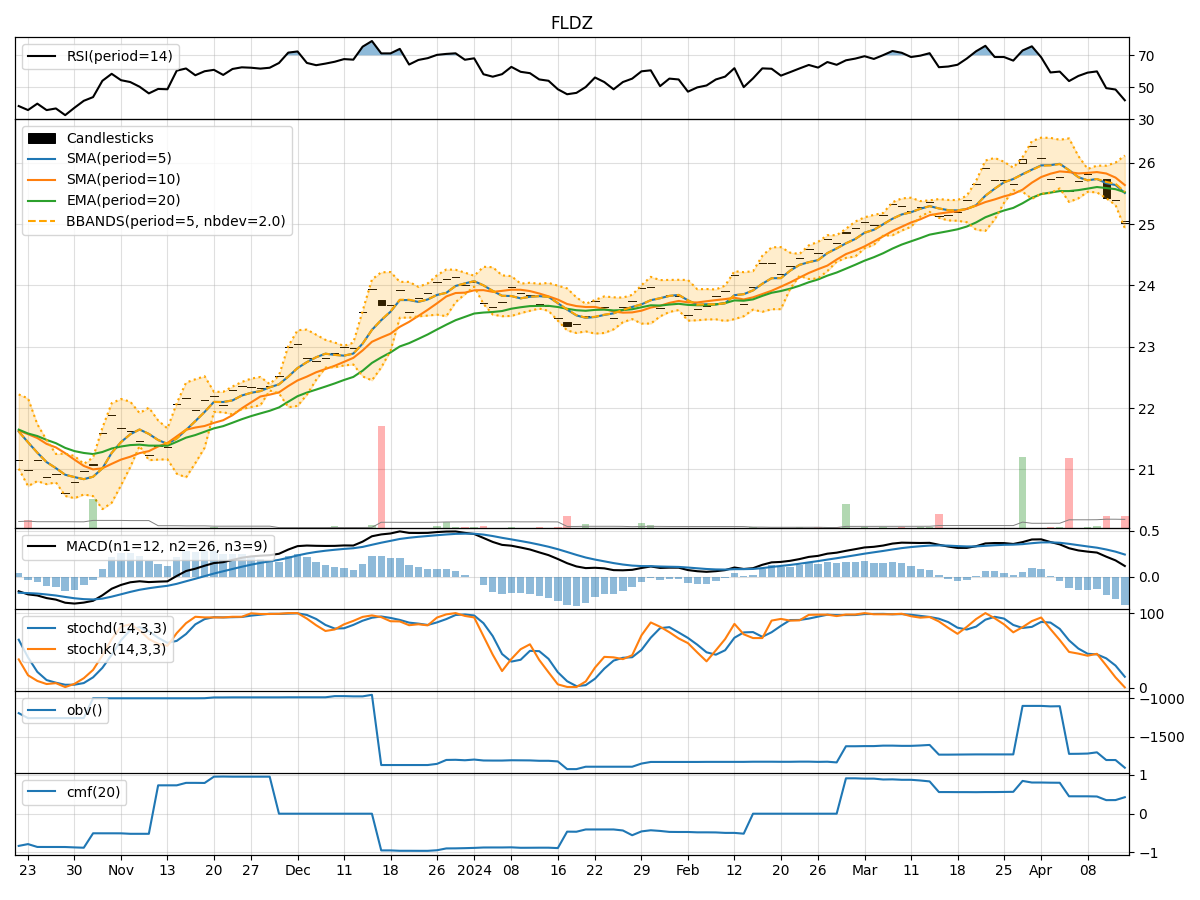
In analyzing the technical indicators for FLDZ over the last 5 days, we will delve into the trend, momentum, volatility, and volume indicators to provide a comprehensive outlook on the possible stock price movement in the coming days.
Trend Indicators:
- Moving Averages (MA): The 5-day MA has been consistently above the closing prices, indicating a short-term uptrend.
- MACD: The MACD line has been positive and increasing, suggesting bullish momentum.
- RSI: The RSI has been fluctuating around the 60-65 range, indicating a neutral stance.
Momentum Indicators:
- Stochastic Oscillator: Both %K and %D have been in the overbought zone, signaling potential overvaluation.
- Williams %R: The indicator has been hovering around oversold levels, suggesting a possible reversal.
Volatility Indicators:
- Bollinger Bands (BB): The stock price has been trading within the bands, indicating a period of consolidation.
- BB% (Bollinger Band %B): The %B has been fluctuating around the midline, reflecting a lack of clear trend direction.
Volume Indicators:
- On-Balance Volume (OBV): The OBV has been relatively flat, indicating a balance between buying and selling pressure.
- Chaikin Money Flow (CMF): The CMF has been positive but declining, suggesting weakening buying pressure.
Key Observations:
- The trend indicators point towards a bullish bias with positive MACD and MA signals.
- Momentum indicators show conflicting signals with overbought stochastic levels and oversold Williams %R.
- Volatility indicators suggest a period of consolidation with the stock trading within the Bollinger Bands.
- Volume indicators indicate a lack of significant accumulation or distribution.
Conclusion:
Based on the analysis of the technical indicators, the next few days for FLDZ could see sideways movement or consolidation as the stock appears to be in a period of indecision. The conflicting signals from momentum indicators and the lack of clear trend direction from volatility indicators suggest a potential lack of strong momentum in either direction. Traders may need to exercise caution and wait for clearer signals before taking significant positions.