Technical Analysis of FLEE 2024-05-10
Overview:
In analyzing the technical indicators for FLEE stock over the last 5 days, we will delve into the trend, momentum, volatility, and volume indicators to provide a comprehensive outlook on the possible stock price movement in the coming days. By examining these key indicators, we aim to offer valuable insights and predictions for potential investors.
Trend Indicators:
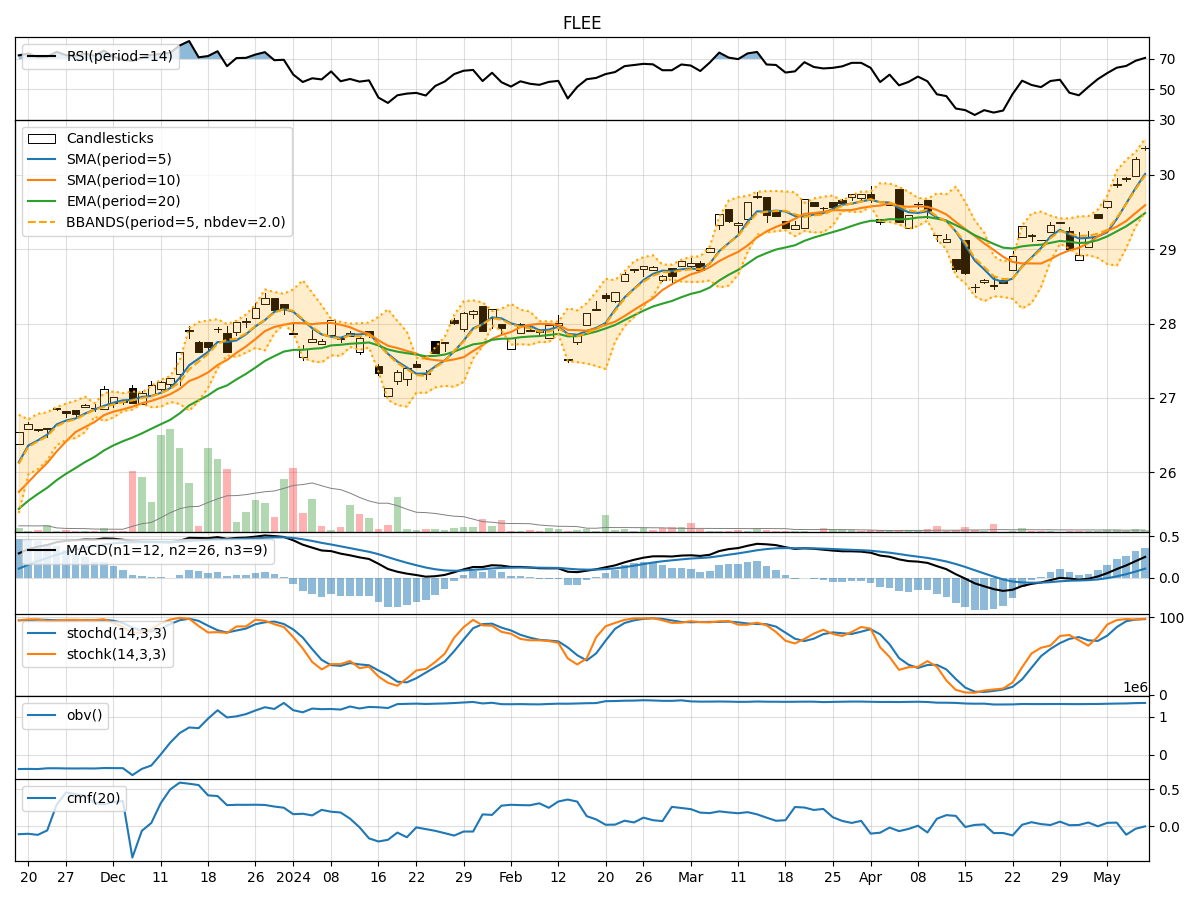
- Moving Averages (MA): The 5-day moving average has been consistently above the simple moving average (SMA) and exponential moving average (EMA), indicating a bullish trend.
- MACD: The MACD line has been above the signal line, with both lines showing an upward trend, suggesting positive momentum.
- MACD Histogram: The histogram has been increasing, indicating strengthening bullish momentum.
Momentum Indicators:
- RSI: The Relative Strength Index (RSI) has been in the overbought territory, suggesting a strong bullish momentum.
- Stochastic Oscillator: Both %K and %D have been in the overbought zone, indicating a potential reversal or consolidation.
- Williams %R: The Williams %R has been in the oversold region, signaling a potential buying opportunity.
Volatility Indicators:
- Bollinger Bands: The stock price has been trading within the upper Bollinger Band, indicating an overbought condition.
- Bollinger Band Width: The band width has been narrowing, suggesting a decrease in volatility.
- Bollinger Band %B: The %B indicator has been above 0.8, indicating a potentially overbought market.
Volume Indicators:
- On-Balance Volume (OBV): The OBV has been increasing, suggesting accumulation by investors.
- Chaikin Money Flow (CMF): The CMF has been fluctuating around the zero line, indicating a balance between buying and selling pressure.
Key Observations and Opinions:
- Trend: The trend indicators suggest a strong bullish sentiment in the market.
- Momentum: The momentum indicators indicate a potential overbought condition, signaling a need for caution.
- Volatility: Volatility has been decreasing, which could lead to a period of consolidation.
- Volume: The increasing OBV reflects positive buying pressure, while the CMF indicates a balanced market sentiment.
Conclusion:
Based on the analysis of the technical indicators, the next few days for FLEE stock are likely to see a continuation of the upward trend but with potential signs of overbought conditions. Investors should be cautious of a possible reversal or consolidation in the near term. It is advisable to closely monitor the price action and key support/resistance levels to make informed trading decisions.