Technical Analysis of FLEU 2024-05-10
Overview:
In analyzing the technical indicators for FLEU over the last 5 days, we will delve into the trend, momentum, volatility, and volume indicators to provide a comprehensive outlook on the possible stock price movement in the coming days. By examining these key indicators, we aim to offer valuable insights and predictions to guide your investment decisions.
Trend Analysis:
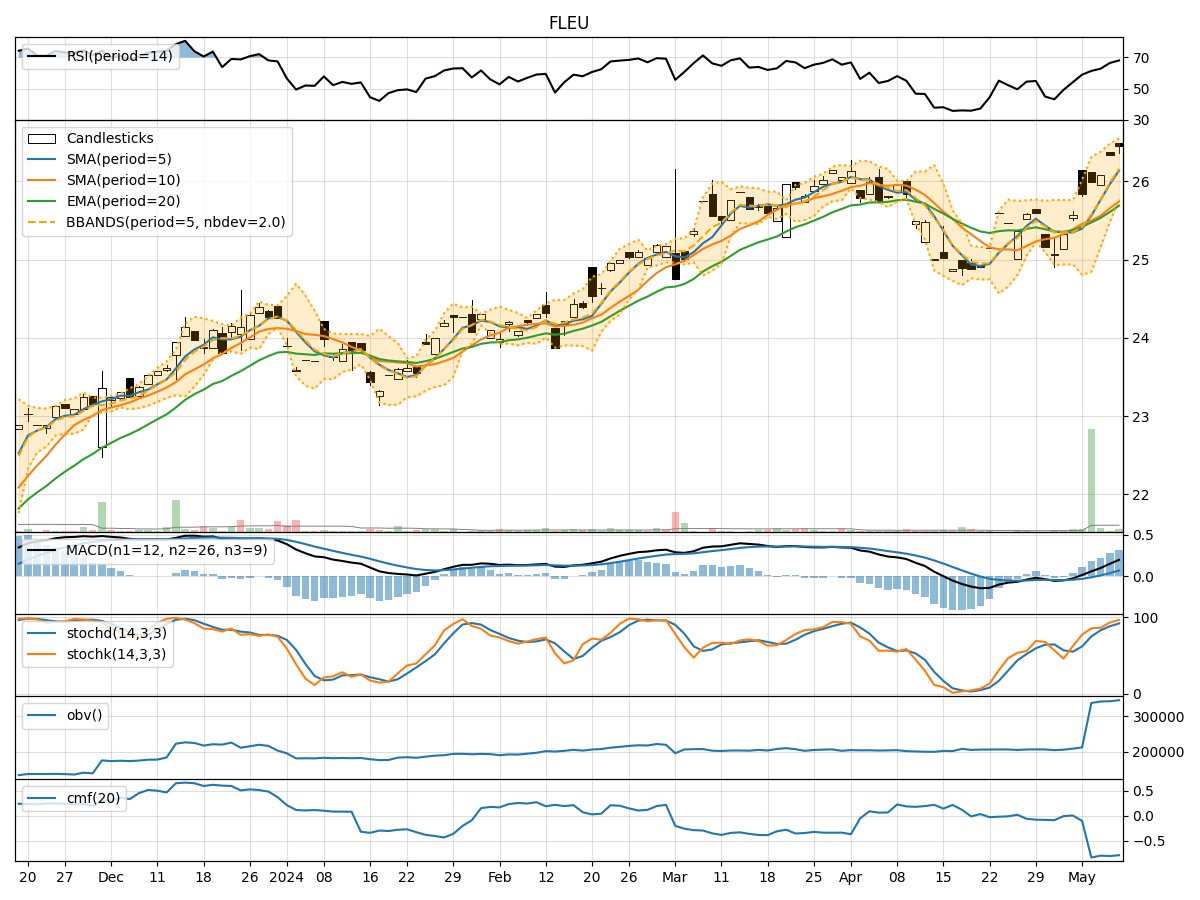
- Moving Averages (MA): The 5-day Moving Average (MA) has been consistently rising, indicating a bullish trend in the short term.
- MACD: The Moving Average Convergence Divergence (MACD) has shown positive values, suggesting upward momentum in the stock price.
- EMA: The Exponential Moving Average (EMA) has been trending upwards, supporting the bullish sentiment in the market.
Momentum Analysis:
- RSI: The Relative Strength Index (RSI) has been increasing, reflecting growing buying pressure and potential overbought conditions.
- Stochastic Oscillator: Both %K and %D values of the Stochastic Oscillator are in the overbought territory, signaling a potential reversal or consolidation.
- Williams %R: The Williams %R indicator is also in the overbought zone, indicating a possible pullback in the stock price.
Volatility Analysis:
- Bollinger Bands: The Bollinger Bands are widening, suggesting increased volatility in the stock price.
- Bollinger %B: The %B indicator is hovering around 0.85, indicating that the stock is trading near the upper band and may be overbought.
Volume Analysis:
- On-Balance Volume (OBV): The OBV indicator has been relatively flat, indicating a balance between buying and selling pressure.
- Chaikin Money Flow (CMF): The CMF is negative, suggesting that money is flowing out of the stock.
Conclusion:
Based on the analysis of the technical indicators, the stock of FLEU is currently in an overbought state, with multiple indicators pointing towards a potential reversal or consolidation in the near future. The bullish trend may lose momentum, and a pullback could be expected. Traders should exercise caution and consider taking profits or implementing risk management strategies. It is advisable to wait for confirmation signals such as a bearish crossover in the MACD or a reversal in the Stochastic Oscillator before making any trading decisions.