Technical Analysis of FLGR 2024-05-10
Overview:
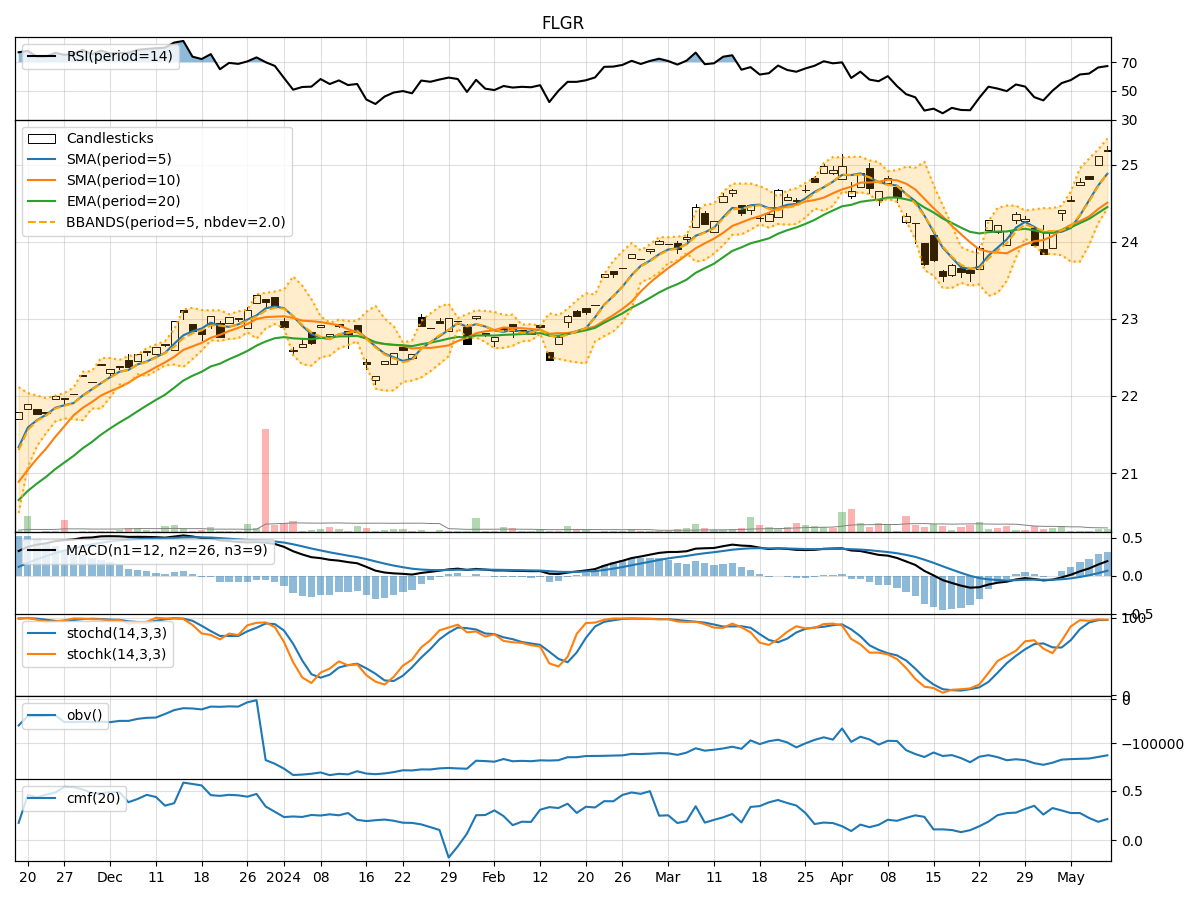
In analyzing the technical indicators for FLGR over the last 5 days, we will delve into the trend, momentum, volatility, and volume indicators to provide a comprehensive outlook on the possible stock price movement in the coming days. By examining these key indicators, we aim to offer valuable insights and predictions for potential investors.
Trend Indicators:
- Moving Averages (MA): The moving averages show a consistent uptrend over the last 5 days, with the closing price consistently above the short-term moving averages.
- MACD: The MACD line has been consistently positive, indicating a bullish momentum in the stock.
- MACD Histogram: The MACD histogram has been increasing, suggesting strengthening bullish momentum.
Key Observation: The trend indicators suggest a strong bullish trend in FLGR.
Momentum Indicators:
- RSI: The RSI has been consistently above 50, indicating bullish momentum in the stock.
- Stochastic Oscillator: Both %K and %D have been in the overbought zone, signaling a strong bullish momentum.
- Williams %R: The Williams %R has been fluctuating but generally in the oversold territory, indicating potential buying opportunities.
Key Observation: Momentum indicators support the bullish sentiment in FLGR.
Volatility Indicators:
- Bollinger Bands: The stock price has been trading within the upper Bollinger Band, indicating an overbought condition.
- Bollinger Band Width: The band width has been narrowing, suggesting a potential decrease in volatility.
- Bollinger Band %B: The %B indicator has been above 0.8, indicating an overbought condition.
Key Observation: Volatility indicators suggest a potential decrease in volatility and a possible consolidation phase.
Volume Indicators:
- On-Balance Volume (OBV): The OBV has been steadily increasing, indicating strong buying pressure in the stock.
- Chaikin Money Flow (CMF): The CMF has been positive, suggesting that money is flowing into the stock.
Key Observation: Volume indicators support the bullish trend in FLGR.
Conclusion:
Based on the analysis of trend, momentum, volatility, and volume indicators, the overall outlook for FLGR is strongly bullish in the short term. The stock is likely to continue its upward trajectory in the coming days, supported by positive trends in all key indicators. Investors may consider entering long positions or holding onto existing positions to capitalize on the potential price appreciation.
Key Conclusion: Upward movement is highly probable in the next few days for FLGR.