Technical Analysis of FLHY 2024-05-10
Overview:
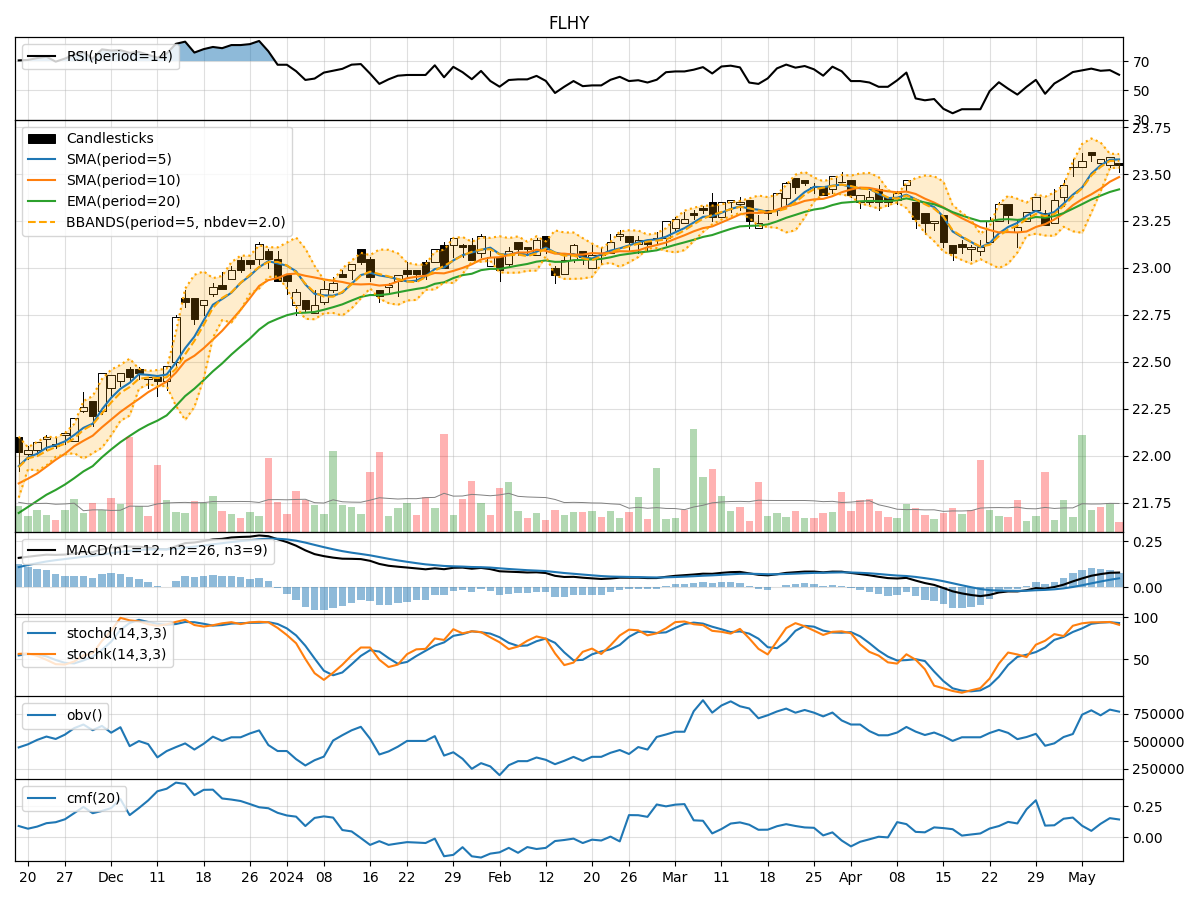
In the last 5 trading days, FLHY stock has shown a relatively stable performance with minor fluctuations in price and volume. The technical indicators across trend, momentum, volatility, and volume provide insights into the stock's potential future movements. Let's delve deeper into each category of indicators to form a comprehensive analysis and make informed predictions.
Trend Indicators:
- Moving Averages (MA): The 5-day MA has been consistently above the 10-day SMA, indicating a short-term bullish trend. The EMA(20) has shown a slight upward trajectory, suggesting a positive momentum.
- MACD: The MACD line has been above the signal line, indicating a bullish trend. The MACD histogram has been mostly positive, reflecting increasing bullish momentum.
Momentum Indicators:
- RSI: The RSI has been fluctuating around the 60-70 range, indicating a neutral to slightly bullish momentum.
- Stochastic Oscillator: Both %K and %D have been in the overbought zone, suggesting a potential reversal or consolidation in the near term.
- Williams %R: The Williams %R has been consistently in the oversold territory, indicating a potential buying opportunity.
Volatility Indicators:
- Bollinger Bands (BB): The stock price has mostly stayed within the bands, indicating a period of low volatility. The bands are relatively narrow, suggesting a potential breakout or significant price movement.
- Bollinger %B: The %B indicator has been hovering around 0.5, indicating a neutral position within the bands.
Volume Indicators:
- On-Balance Volume (OBV): The OBV has shown a slight increase over the last 5 days, indicating some accumulation by investors.
- Chaikin Money Flow (CMF): The CMF has been positive, suggesting that money is flowing into the stock.
Key Observations and Opinions:
- Trend: The stock is currently in an upward trend based on moving averages and MACD.
- Momentum: The momentum indicators suggest a neutral to slightly bullish bias in the short term.
- Volatility: The stock is experiencing low volatility, but the narrowing Bollinger Bands indicate a potential breakout.
- Volume: The volume indicators show moderate buying interest in the stock.
Conclusion:
Based on the analysis of technical indicators, the next few days for FLHY stock are likely to see continued upward movement with potential for a breakout due to the narrowing Bollinger Bands. Investors should consider entering long positions or holding onto existing positions. However, caution is advised as the stochastic oscillator indicates an overbought condition, and a pullback or consolidation could occur. Overall, the outlook for FLHY stock is bullish in the short term.