Technical Analysis of FLJJ 2024-05-10
Overview:
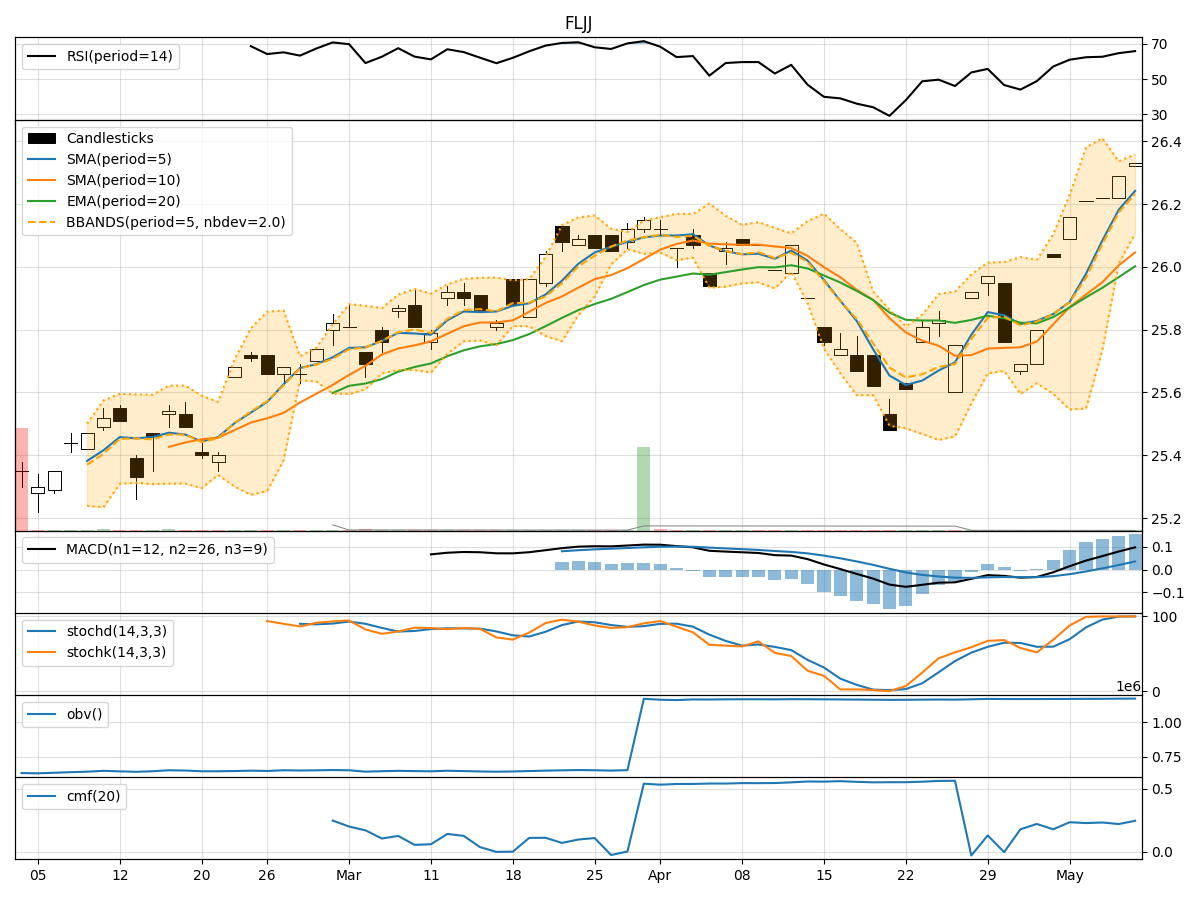
In analyzing the technical indicators for FLJJ stock over the last 5 days, we will delve into the trends, momentum, volatility, and volume aspects to provide a comprehensive outlook on the possible stock price movement in the coming days. By examining key indicators such as moving averages, MACD, RSI, Bollinger Bands, and OBV, we aim to offer valuable insights and predictions for potential price movements.
Trend Analysis:
- Moving Averages (MA): The 5-day MA has been consistently above the 10-day SMA, indicating a short-term bullish trend.
- MACD: The MACD line has been trending upwards, with the MACD histogram showing positive values, suggesting bullish momentum.
Momentum Analysis:
- RSI: The RSI has been gradually increasing and is currently in the overbought territory, signaling potential strength in the uptrend.
- Stochastic Oscillator: Both %K and %D have been at 100%, indicating strong buying pressure and potential continuation of the uptrend.
Volatility Analysis:
- Bollinger Bands (BB): The stock price has been trading within the upper Bollinger Band, suggesting an overbought condition.
Volume Analysis:
- On-Balance Volume (OBV): The OBV has been steadily increasing, indicating accumulation by investors.
Key Observations:
- The stock is exhibiting bullish momentum based on the moving averages and MACD.
- The RSI and Stochastic Oscillator suggest overbought conditions, which could lead to a potential pullback.
- The OBV reflects positive volume accumulation, supporting the current uptrend.
- The Bollinger Bands indicate high volatility and a possible reversal or consolidation phase.
Conclusion:
Based on the technical analysis of FLJJ stock, the next few days may see a potential pullback or consolidation as the stock is currently in overbought territory according to the RSI and Stochastic Oscillator. Investors should exercise caution and consider taking profits or implementing risk management strategies. The overall trend remains bullish, but a short-term correction or sideways movement is likely before any further upward momentum.